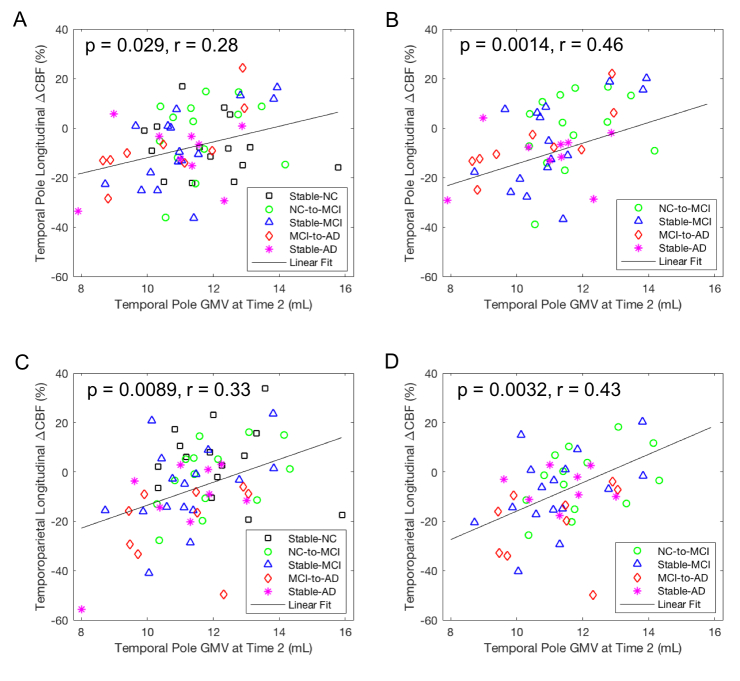
Figure 3.
Correlation of longitudinal CBF changes from Time 2 to Time 3 in the temporoparietal region with GMV values at Time 2 after adjusting for age, gender, and time gap from Time 2 to Time 3. Longitudinal CBF changes in the temporoparietal region were significantly associated with (A) temporoparietal GMV values for all of the subjects (n = 63), (B) temporoparietal GMV values for the subjects with AD progression (n = 48), (C) temporal pole GMV values for all of the subjects (n = 63), and (D) temporal pole GMV values for the subjects with AD progression (n = 48).

