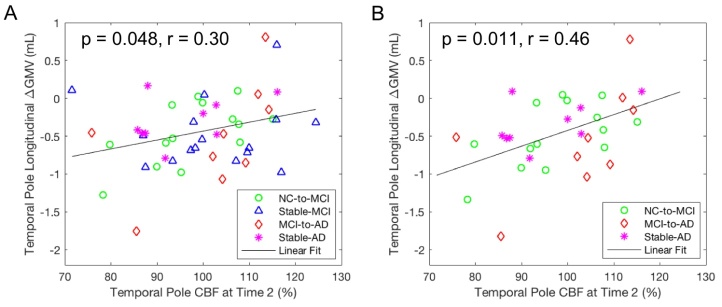
Figure 5.
Correlation of longitudinal GMV changes from Time 2 to Time 3 with CBF values at Time 2 after adjusting for age, gender, and time gap. Longitudinal GMV changes in the temporal pole region were significantly correlated with its CBF values for (A) the subjects with AD progression (n = 48) and (B) the subjects with definite AD progression (n = 32).

