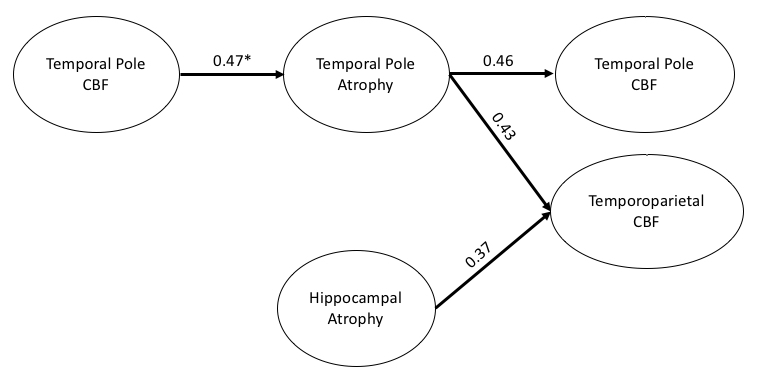
Figure 6.

Correlation model of relationship among temporal pole CBF, temporoparietal CBF, temporal pole atrophy, and hippocampal atrophy. Path weights are partial correlation coefficients after adjusting for age, gender, and time gap for all of the subjects with AD progression (n = 48, excluding the stable NC subjects). The direction of arrows is from an early event to a later event. * Stands for partial correlation coefficients for all of the subjects with definite AD progression (n = 32, excluding the stable NC and stable MCI subjects).
