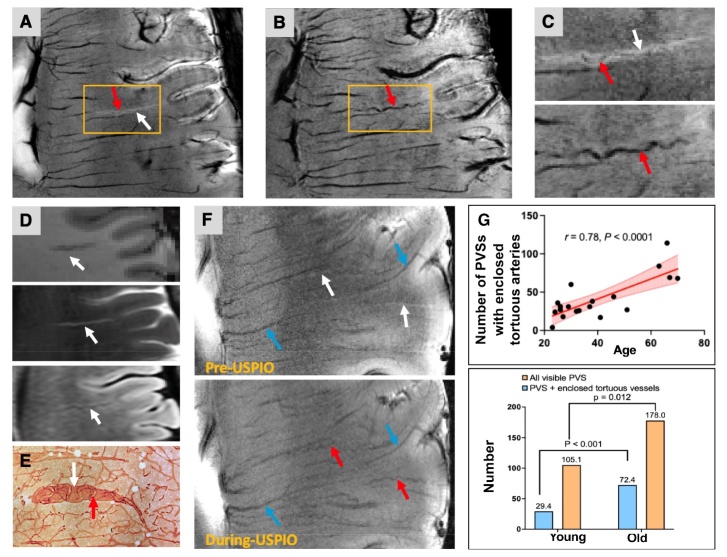
Figure 6.
With Ferumoxytol, the 2D gradient echo (2D-GRE) data (A) and 3D susceptibility-weighted imaging (SWI) data (B) revealed a perivascular space (PVS) and the enclosed tortuous artery. Unless otherwise noted, arteries, veins, and PVS are indicated by red, blue, and white arrows. (C) Magnified view of yellow boxes in the 2D GRE (up) and post-contrast SWI (bottom). (D) Perivascular space (PVS) in the conventional MRI (i.e., T1-weighted (left), T2-weighted (middle), and fluid-attenuated inversion recovery (FLAIR) MRI (right)). (E) A thick celloidin section stained with the antibody to collagen IV showed tortuous arterioles screwed in the cavities. (E was reprinted from Brown et al., (2002)). (F) Linear hyperintense PVSs (white arrows) and veins (blue arrows) were revealed in the pre-USPIO 2D-GRE MRI. With USPIO, enclosed tortuous arteries (red arrows) could be detected. The PVSs were less evident in the image data with USPIO, which might be attributable to the susceptibility blooming effects induced by the contrast agent. (G) The number of PVSs with enclosed tortuous arteries was positively associated with age (n = 19, r=0.78, p<0.0001). Compared with young subjects (n=14), the old subjects (n=5) had more PVS (p=0.012), more PVS with tortuous arteries enclosed (P <0.001). The ratio between PVS with enclosed tortuous arteries and total visible PVS was higher in old subjects (40.7%) versus young subjects (28%). Significance was determined using an independent t-test followed by Bonferroni correction. Significance level was set at p<0.025 adjusting for 2 tests.

