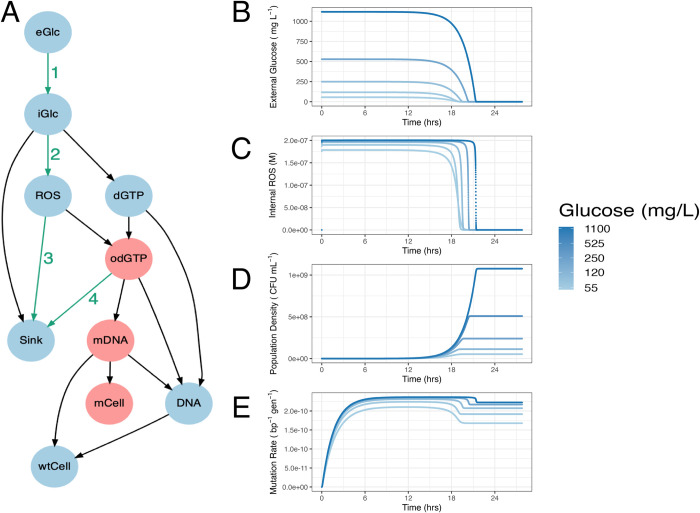
Fig 1. Dynamical computational model of growth, metabolism, and mutagenesis in E. coli.
(A) Model structure connecting variables. Red variables indicate the pathway to mutagenesis; green numbered arrows indicate pathways targeted by model variants. This structure was represented in ODEs (Eqs 1–10, Methods), parameterised from the literature (Table 2), and simulated from appropriate starting values (Table 1) to give output shown in B–E. (B) Kinetics of eGlc, (C) molar concentration of ROS in the cytoplasm, (D) population density calculated as the number of genomes in the 1 ml culture (wtCell/GCperGen), and (E) mutation rate calculated as the ratio of mutated to total base pairs therefore representing the chance of a single base-pair mutating in a single division (generation); this is a cumulative measure of mutation rate in the sense that it considers all the mutations that have accumulated up to the given time, making it directly comparable to experimental measures of mutation rate. Panels B–E are plotted for 5 initial glucose concentrations (range 55 – 1,100 mg L-1 as shown in legend), initial glucose concentration indicated by line colour. Raw data for panels A–E can be found in S1 Data. eGlc, external glucose concentration; ODE, ordinary differential equation; ROS reactive oxygen species.

