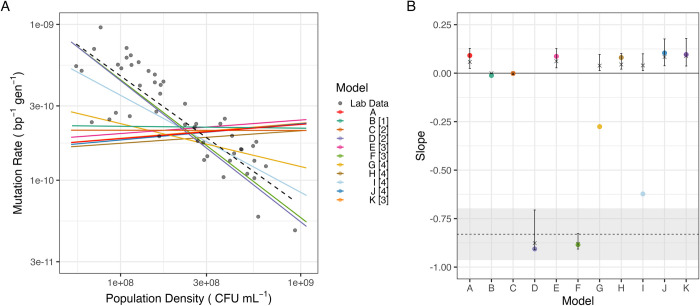
Fig 2. Mutation rates in model variants.
(A) Solid coloured lines show fitted log-log linear relationship between final population density and mutation rate for models A to K (Regression 1 (SI)); numbers 1–4 in legend indicate the pathway targeted from Fig 1A. Black points and dashed line show lab data for E. coli wild-type BW25113 in glucose minimal media with a log-log linear regression fitted (Regression 2 (SI)). (B) Global sensitivity analysis; coloured points show slopes from baseline parameters (as in Fig 2A), and crosses and error bars show median and interquartile range of slope across 5 × 10⁵ randomly perturbed parameter sets, models are coloured as in Fig 2A. Dashed line shows slope of lab data in Fig 2A (Regression 2), and grey area shows 95% CI on this slope. Raw data for panel A can be found in S2 Data, raw data for panel B (prior to filtering) can be found in S3 Data, and summary statistics as plotted can be found in S4 Data. eGlc, external glucose concentration; ODE, ordinary differential equation.

