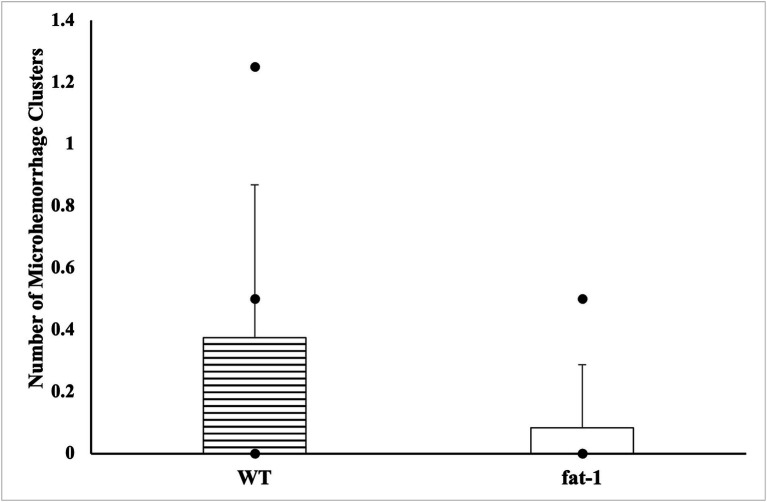
Figure 4.
Appearance of cerebral microhemorrhage clusters by Prussian Blue staining for mice at the 168 h timepoint following the last WDI [n = 6/group; wildtype (WT); fat-1; WT control and fat-1 control]. WT control and fat-1 control had no detectable staining and therefore not shown. * denotes a significant difference (p ≤ 0.05) by two-tailed t-test. Data are presented as mean values ± SD.

