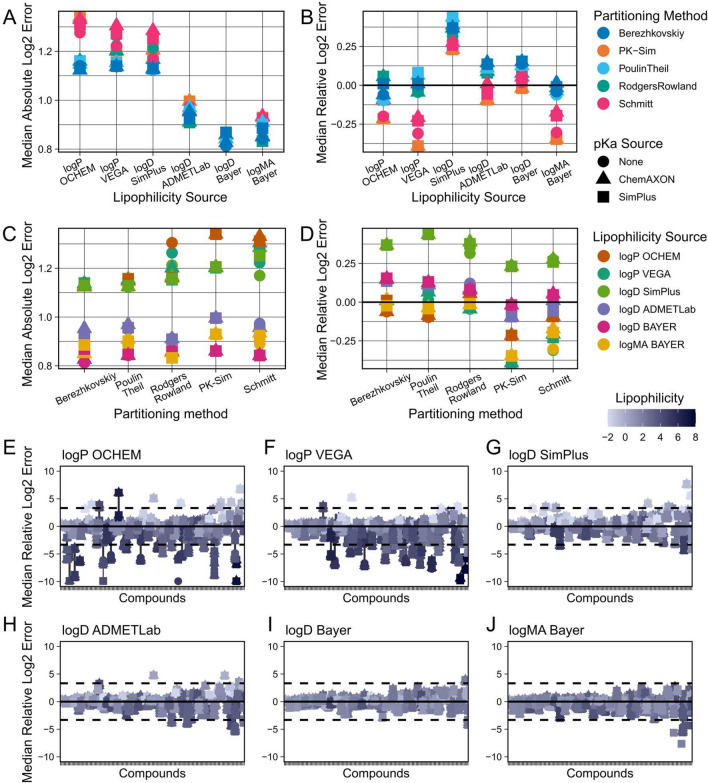
Fig. 3.
Comparison of predictive performances of different physico-chemical parameter sources (step 1). Combinations of all available PBK model parameterisation sources were evaluated against the collected IV dataset. Clearance and fraction unbound were parameterised using in vivo and in vitro benchmark reference values, respectively. The top row shows Median Absolute Log2 Errors (A) and Median Relative Log2 Errors (B) for different lipophilicity prediction methods. The middle row shows Median Absolute Log2 Errors (C) and Median Relative Log2 Errors (D) for different partitioning methods. The bottom rows (E–J) show the Relative Log2 Errors of predictions for every individual compound for the different lipophilicity prediction tools used. Dashed lines indicate tenfold errors

