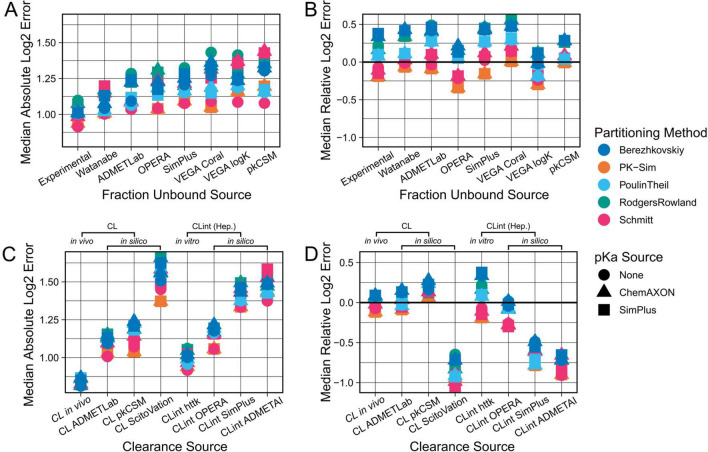
Fig. 4.
Comparison of predictive performances of different fraction unbound and clearance prediction sources (step 2). Combinations of all available parameterisation sources were evaluated against the collected IV dataset. Results shown were generated using benchmark values for parameterisation of the other parameters, i.e., in vitro CLint values from httk when comparing Fu predicting sources, and in vitro measured Fu values when comparing clearance predicting sources, as well as the mean of the two previously determined best lipophilicity prediction tools (LogD and LogMA Bayer) as lipophilicity values. The top row shows the Median Absolute Log2 Errors (A) and the Median Relative Log2 Errors (B) for different fraction unbound prediction methods. The bottom row shows the Median Absolute Log2 Errors (C) and the Median Relative Log2 Errors (D) for different clearance prediction methods. CL refers to plasma clearance values (measured or predicted), and CLint signifies hepatocyte intrinsic clearance (measured or predicted). In vitro measured CLint values from httk were only available for a subset of compounds (97 out of 143)

