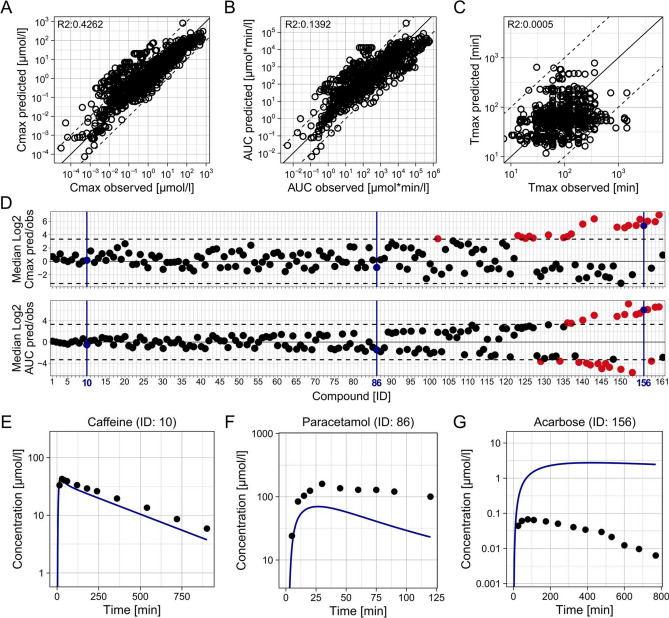
Fig. 6.
Predictive performance of the best fully in silico-based HT-PBK modelling strategy (proprietary). HT-PBK models were generated following the approach outlined in Table 1, then model simulations were compared against the collected PO dataset of 161 compounds (dissolved and solid formulations). A Predicted against observed Cmax values of all concentration–time profiles in the PO dataset. B Predicted against observed AUC values. C Predicted against observed Tmax values. Mind that A–C show individual concentration–time profiles with some compounds only represented by a single and others by multiple PK profiles. D The median Log2 Cmax and AUC predicted/observed values of each compound in the PO dataset. Dashed lines indicate tenfold errors. E–G Representative concentration–time profile predictions, and corresponding in vivo PK data, of three compounds embodying different levels of prediction quality. Blue colour marks the same representative compounds in D (colour figure online)

