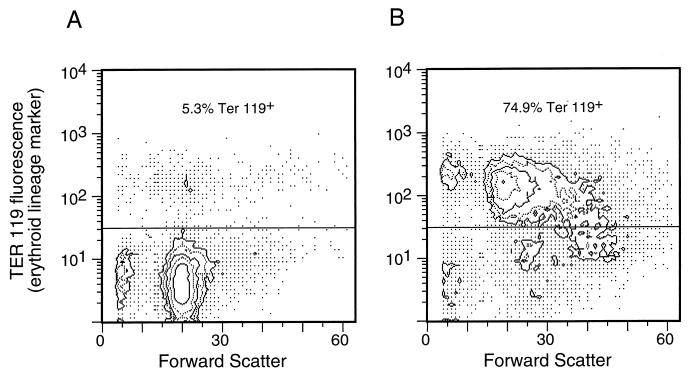
FIG. 4.
Flow cytometric analysis of erythroid cells in CD4 deficient mice. (A) Nucleated spleen cells from an uninfected CD4-deficient B6 mouse stained with the erythroid cell surface marker Ter-119 (20) in the vertical direction. This mouse spleen contained 5.3% Ter-119+ cells. (B) Ter-119 staining of spleen cells from an FV-infected CD4-deficient mouse harvested at 7 weeks postinfection. This mouse had a grossly enlarged spleen with 1.1 × 10⁹ total cells and 2.2 × 10⁶ F-MuLV-positive ICs per spleen. A total of 74.9% of the cells stained positive for the Ter-119. The percentages of the cells with surface markers for other cell lineages were also markedly distorted. There were as follows: <1%, CD4+ cells; 1.8%, CD8+ cells; 3.5%, Mac-1+ cells; and 3.5%, B220+ cells. The shift in forward scatter in the infected cells reflects a shift to a larger size.

