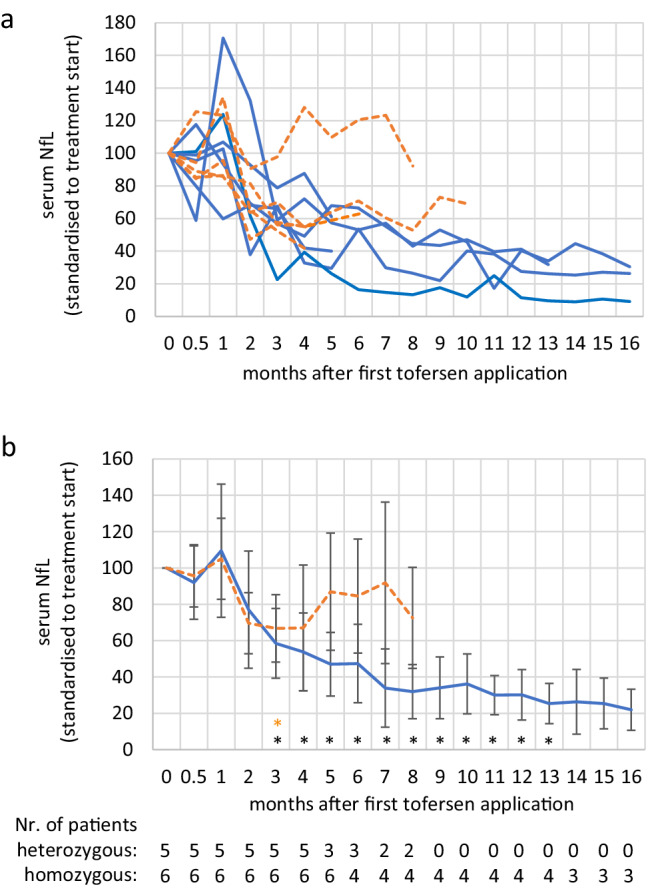
Fig. 1. Serum NfL course in tofersen-treated SOD1D91A mutant patients.

a Serum neurofilament light chain (sNfL) levels during treatment with tofersen. For better comparability, values were normalized to the timepoint directly before the start of treatment. Values from patients with heterozygous mutations are depicted with a dashed orange line, homozygous patients are depicted in blue. b Mean sNfL values ± S.D. of patients shown in b). Values were normalized to the timepoint directly before the start of treatment. Asterisk indicates significant reduction when compared to start of treatment in patients with a homozygous mutation (repeated measures ANOVA*: p < 0.05; orange asterisk (top row of asterisks): refers to heterozygous patients; black asterisks (bottom row of asterisks): homozygous patients; the exact p values can be found in Supplementary Data 1). Two NfL measurements have been missed for a heterozygous and homozygous patient at months 5 and 7, respectively. After the sixth injection the number of heterozygous patients was too low for a group-based analysis. The statistics are based on absolute values not normalized to treatment start.
