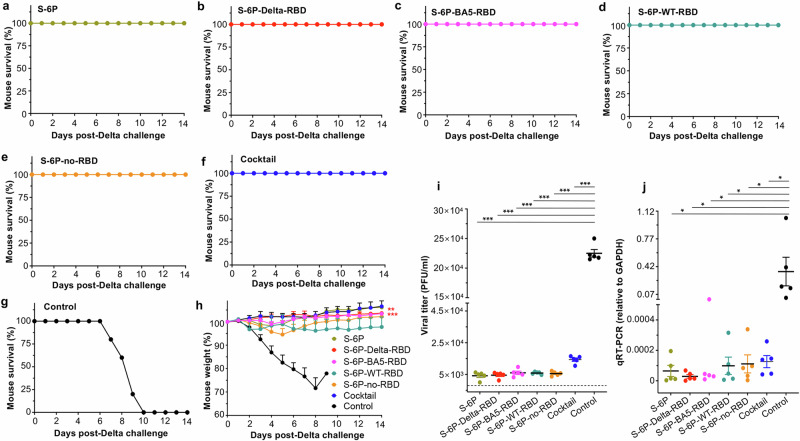
Fig. 3. The designed subunit vaccines protected immunized K18-hACE2 mice against infection of SARS-CoV-2 Delta and Omicron variants.
K18-hACE2 mice were immunized with each protein, including S-6P, S-6P-Delta-RBD, S-6P-BA5-RBD, S-6P-WT-RBD, and S-6P-no-RBD, the cocktail (combination of S-6P-Delta-RBD and S-6P-BA5-RBD proteins) in the presence of adjuvants, or PBS plus adjuvants (control), as described in Fig. 1. The immunized mice were respectively challenged with two SARS-CoV-2 variants, Delta and Omicron (BA.1 subvariant), 2 weeks after the 3rd immunization. The mice challenged with a high lethal dose of Delta variant were observed for survivals (a–g) and body weight changes (h) for 14 days after challenge. The data (h) are presented as the mean + s.e.m. of five mice in each group. Ordinary one-way ANOVA (Dunnett’s multiple comparison test) was used to compare the statistical differences of weight changes between S-6P-Delta-RBD and other groups, and there are significant differences between S-6P-Delta-RBD and S-6P-WT-RBD (**P < 0.01) or PBS control group (***P < 0.001). The mice challenged with an optimal dose of Omicron variant (BA.1) were collected for lung tissues two days after viral infection, and detected for viral titers by plaque assay (i) and viral replication by qPCR assay (j). The data (i, j) are presented as the mean ± s.e.m. of five mice in each group. The limit of detection for the plaque assay was 50 plaque forming units (PFU) (i) and for qPCR assay was Cq value of 35 cycles (j). Ordinary one-way ANOVA (Tukey’s multiple comparison test) was used to compare the statistical differences of viral titers and qPCR results among different groups (i, j). *P < 0.05 and ***P < 0.001 designate significant differences among these groups. The experiments were repeated twice, with similar results.

