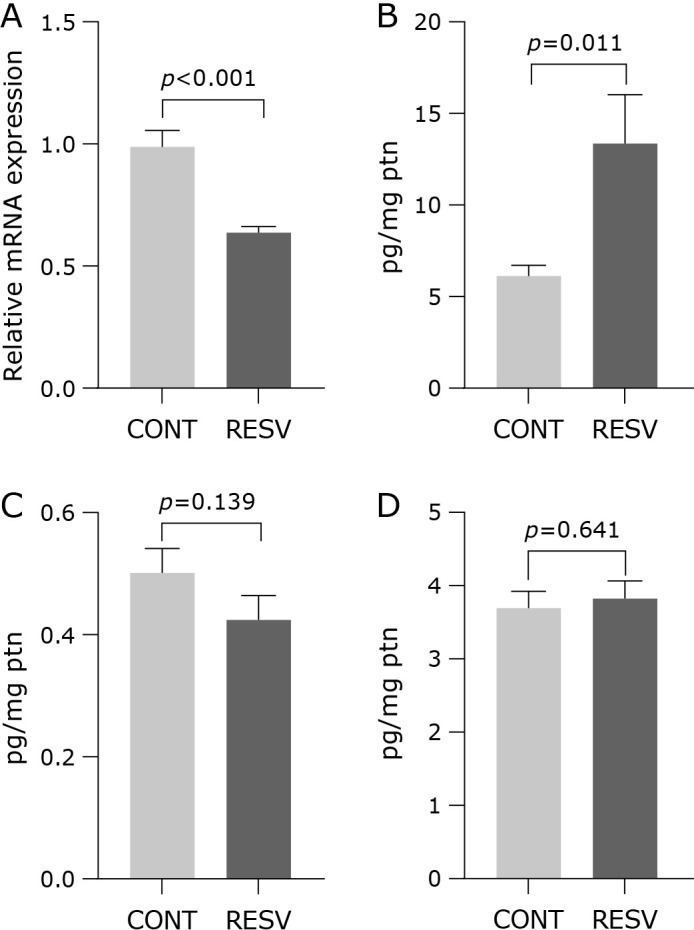
Fig. 5.

Effects of trans-resveratrol in relative mRNA expression of NF-κB and cytokines concentration measured in the liver homogenate. (A) NF-κB, (B) IL-6, (C) TNF-α, (D) IL-10. CONT, control group; RESV, trans-resveratrol group. Values are expressed as mean ± SEM (n = 7/group).
