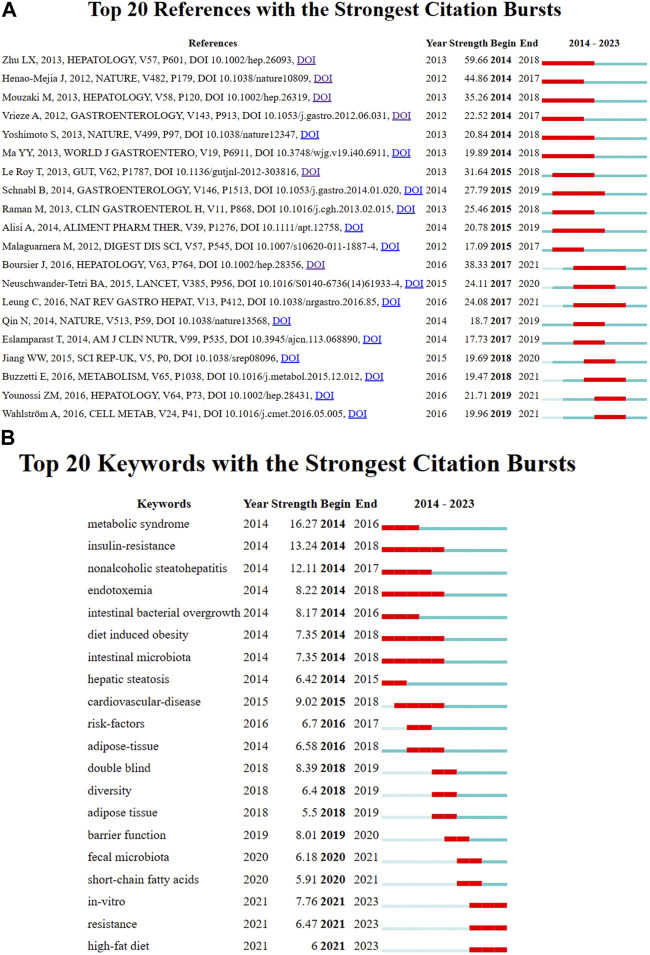
FIGURE 7.
(A) Analysis of the reference with the highest burst strength among 4,069 citing articles on gut microbiota and MASH research published from 2014 to 2023. References marked in red denote a significant increase in usage frequency during this period, while blue indicates a comparatively lower frequency. (B) Keywords with the highest burst strength. Keywords highlighted in red denote a notable increase in usage, while blue denotes a less prominent period of usage. (The figure created using CiteSpace).

