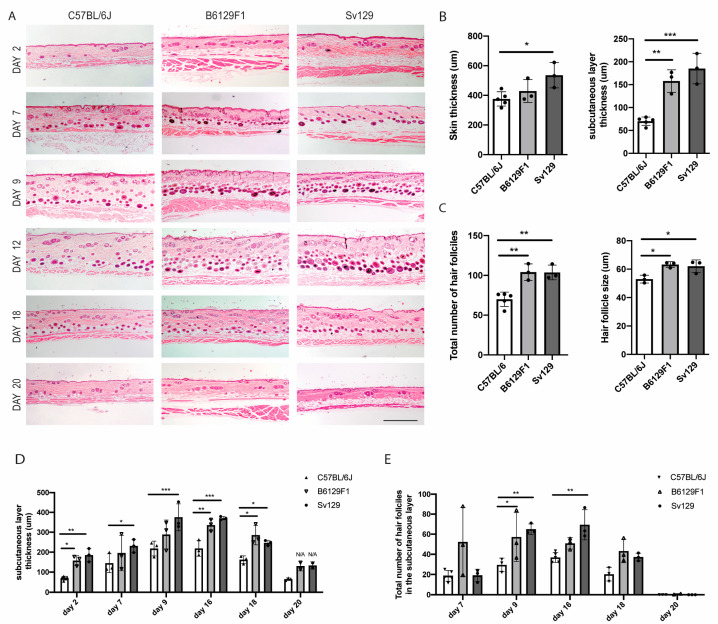
Figure 3.
Histomorphological differences between mouse strains. (A) Hematoxilin-eosin staining of dorsal skin transversal paraffin sections from C57BL/6J, B6129F1, and Sv129 mice at different hair cycle timepoints. Scale bar: 500 μm. (B) Quantification of whole skin thickness and subcutaneous layer thickness in telogen (day 2). (C) Quantification of the total number of hair follicles per field view and of hair follicle size in anagen (day 16). (D,E) Quantification of the (D) subcutaneous layer thickness and (E) total number of hair follicles in the subcutaneous layer (anagenic) at different timepoints across the hair cycle. In total, 3 to 5 mice were analyzed per timepoint per strain, and n ≥ 4 field views were quantified per animal. Dots in graphs correspond to individual animals. Values are mean ± s.d. Statistics were performed using one-way ANOVA, with Tukey´s multiple-comparison correction (B,C) or two-way ANOVA with Tukey´s multiple-comparison correction (D,E), * p < 0.05; ** p < 0.01, *** p < 0.001.

