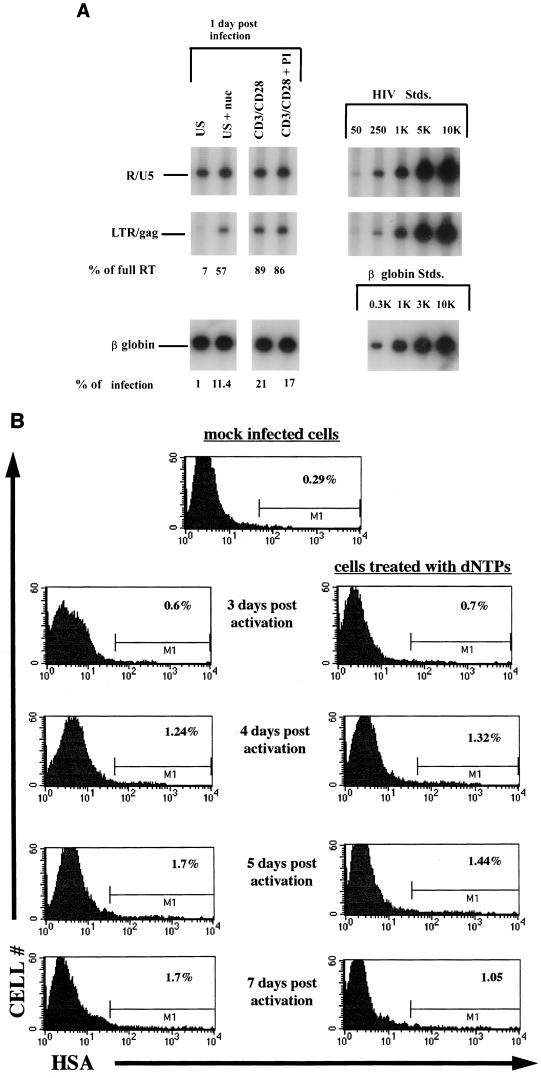
FIG. 4.
(A) HIV-1 reverse transcription of cells infected with NL-r-HSAS following addition of exogenous nucleosides. Unstimulated and costimulated cells were infected with 3 μg of p24 of NL-r-HSAS per 106 cells in the presence or absence of 10 μM of deoxynucleosides (nuc) per ml. Seventeen hours later DNA was harvested and subjected to quantitative PCR with the primer pairs for the R-U5 and LTR-gag regions in the viral DNA and with a primer for the β-globin gene of the genomic DNA. Percentages of initiated reverse transcripts that completed the reverse transcription process (% of full RT) as well as percentages of cells in the population that harbor complete reverse transcription as determined by assessing levels of LTR and gag per β-globin signal (% of infection) are indicated for each of the conditions. US, unstimulated; CD3+CD28, costimulated. Quantitative standards (Stds.) are shown on the right for each primer pair and for the β-globin primer. (B) Effect of nucleoside addition on viral rescue. The quiescent or nucleoside-treated quiescent cells shown in panel A were costimulated 17 h postinfection in the presence of 100 nM PI. At the indicated time points cells were collected and stained for the virus-encoded HSA surface marker. Percentages of HSA+ cells are indicated in each of the corresponding histograms. The results are representative of three separate experiments.

