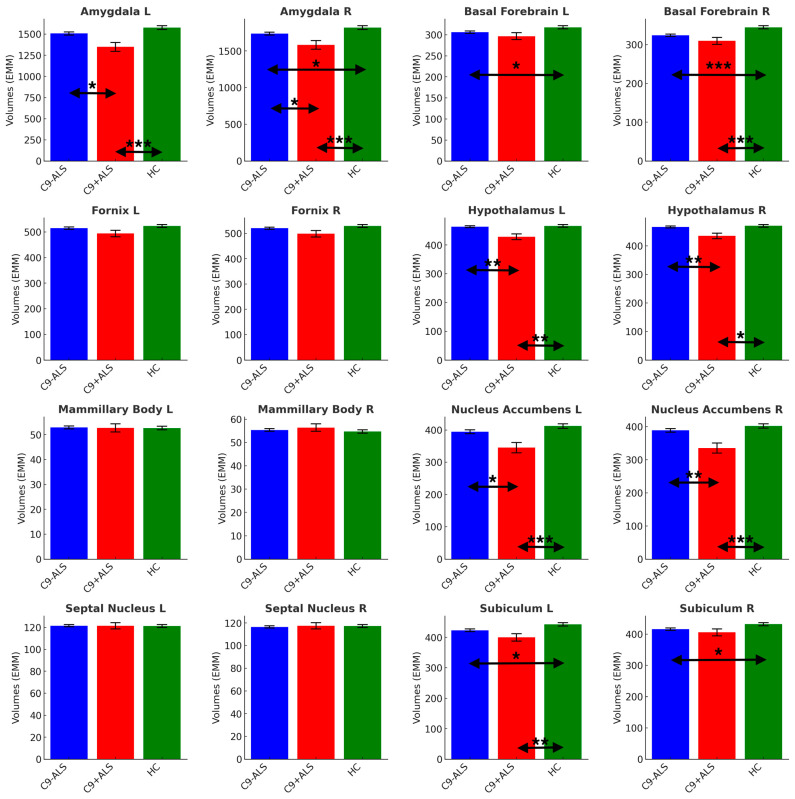
Figure 4.
The limbic volumetric profiles of the study groups. Estimated marginal means (EMM) were calculated, with age, sex, handedness and TIV as covariates. Each measure is shown with error bars representing the standard error (SE). Horizontal arrows indicate statistically significant group differences with the following significance thresholds * p < 0.05, ** p <= 0.005, *** p <= 0.001.

