
FIGURE 3.
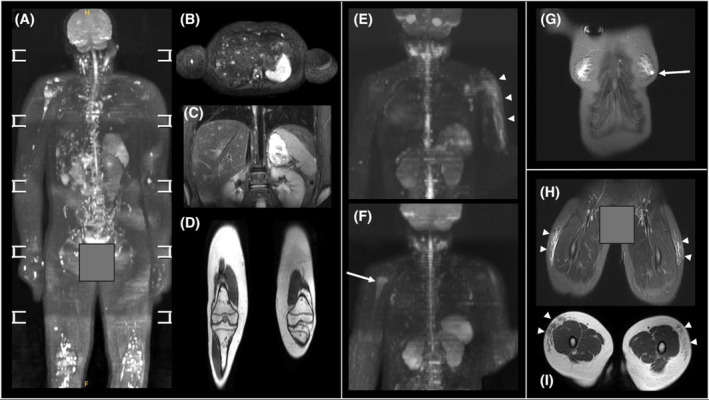
Examples of positive scan findings from four participants: (A) 3D‐rotational MIP b900 DWI image demonstrating multifocal granulomatous disease involving bones, liver and skin; (B) Axial b900 image from the same participant showing the multiple hyperintense liver lesions, as well as lesions in the right humeral shaft and vertebral body; (C) coronal STIR image from the same participant showing multiple hyperintense liver and vertebral body lesons; (D) coronal T1‐weighted mDIXON image through the legs of the same participant showing multiple femoral and tibial bone marrow hypontense foci; (E) 3D‐rotational MIP b50 image showing subcutaneous oedema left upper arm (arrow heads); (F) b900 DWI image from the same participant showing high signal right upper humerus (arrow); (G) coronal STIR image showing left sub‐areolar cyst (arrow); (H) coronal STIR and (I) axial T1 from a participant with bilateral anterolateral thigh subcutaneous oedema.