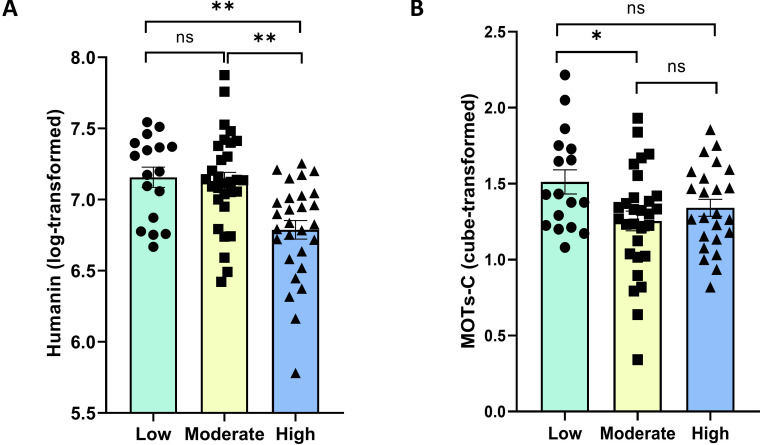
Fig. 2.
The difference in Humanin (A) and MOTS-c (B) serum levels between low, moderate, and high endurance athletic groups. A linear regression model was used to assess differences in these peptides between the different athletic groups. Data is presented as mean SEM for n = 17 low, n = 30 moderate, and n = 28 high endurance participants. Statistical analysis was determined by t-test. Ns = non-significant, * = p 0.05, and ** = p 0.01.

