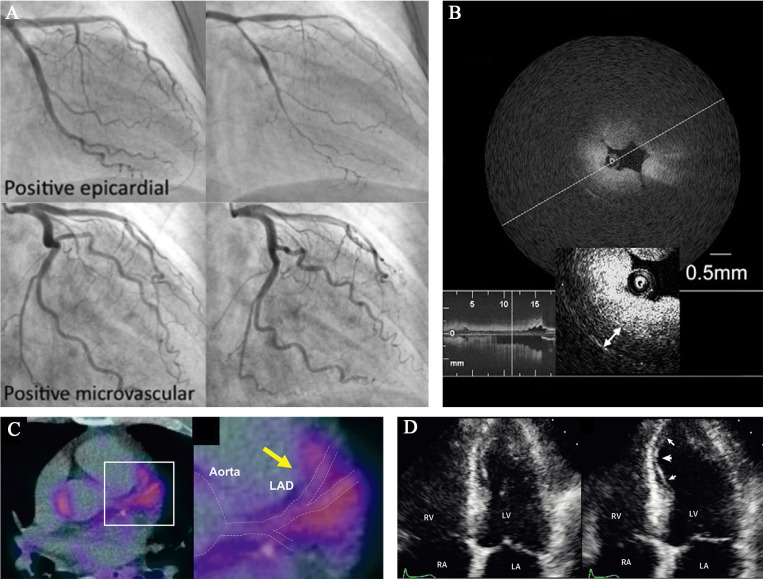
Fig. 3.
Representative images of novel diagnostic approaches for CAS. (A) Coronary angiograms of epicardial and microvascular CAS after spasm provocation test (SPT) using intracoronary perfusion of Ach. Images from Arrebola-Moreno et al. [131]. (B) Optical coherence tomography (OCT) image of a spasm lesion after provocation. Medial thickening led to luminal narrowing with intimal gathering. Image from Tanaka et al. [128]. (C) 18F-fluorodeoxyglucose (FDG) positron emission tomography/computed tomography (PET/CT) image of a CAS patients. FDG uptake of coronary PVAT was significantly increased. Image from Ohyama et al. [109]. (D) Myocardial contrast echocardiography (MCE) was carried out with intravenous injection of ergonovine. Apparent regional wall motion abnormalities (arrows) of the interventricular septum and left ventricular (LV) apex, compared with the resting state (left image). Images from Om et al. [135].

