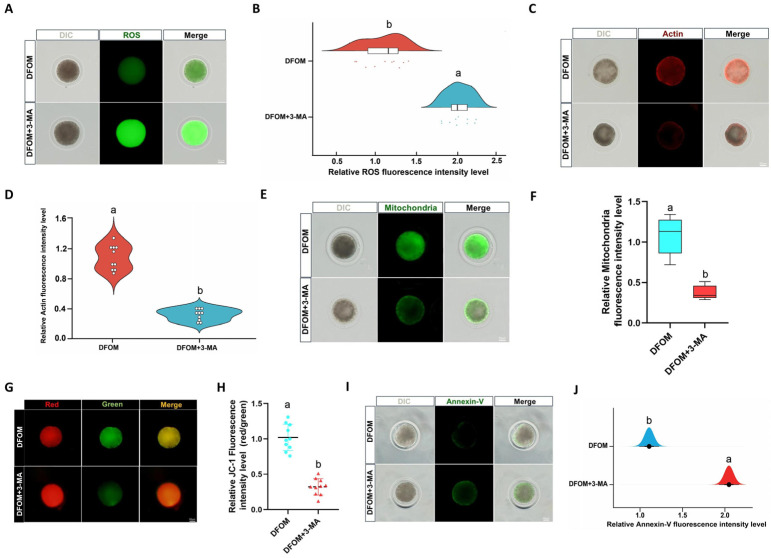
Figure 11.
HIF-1α regulates the developmental potential of yak oocytes through autophagy. (A) Effects of different treatment groups on ROS in oocytes. (B) The relative fluorescence intensity of ROS in oocytes of different treatment groups. (C) Effects of different treatment groups on actin in oocytes. (D) The relative fluorescence intensity of actin in oocytes of different treatment groups. (E) The effects of different treatment groups on the distribution of oocyte mitochondria. (F) Relative fluorescence intensity of oocyte mitochondria in different treatment groups. (G) Effects of different treatment groups on the mitochondrial membrane potential of oocytes. (H) Relative fluorescence intensity of mitochondrial membrane potential in oocytes of different treatment groups. (I) Effects of different treatment groups on early apoptosis of oocytes. (J) Relative fluorescence intensity of oocyte apoptosis in different treatment groups. Bar = 50 μm. Different letters in the histogram indicate statistically significant differences (p < 0.05).

