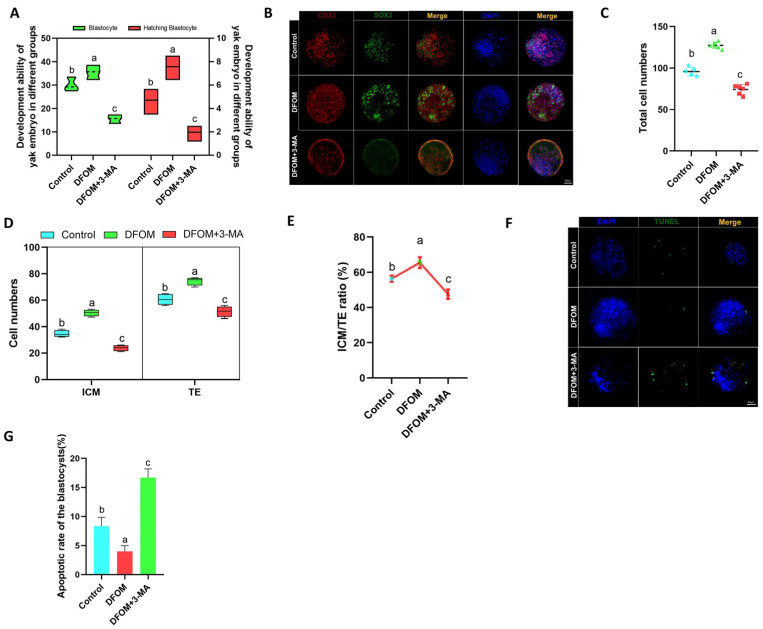
Figure 13.
The effect of HIF-1α on the fate and apoptosis of blastocyst cells after parthenogenetic activation of yak oocytes. (A) Statistics of blastocyst development rate after parthenogenetic activation of oocytes in different treatment groups. (B) Immunofluorescence labeling of CDX2 and SOX2 proteins in blastocysts after parthenogenetic activation of oocytes in different treatment groups. (C) Statistics of total cell number of blastocysts after parthenogenetic activation of oocytes in different treatment groups. (D) The number of ICM cells and TE cells in blastocysts after parthenogenetic activation of oocytes in different treatment groups was counted. (E) The ICM/TE ratio of blastocysts after parthenogenetic activation of oocytes in different treatment groups. (F) TUNEL staining of blastocysts after parthenogenetic activation of oocytes in different treatment groups. (G) Statistics of blastocyst apoptosis rate after parthenogenetic activation of oocytes in different treatment groups. (Bar = 50 μm). The difference of different letters in the histogram was statistically significant (p < 0.05).

