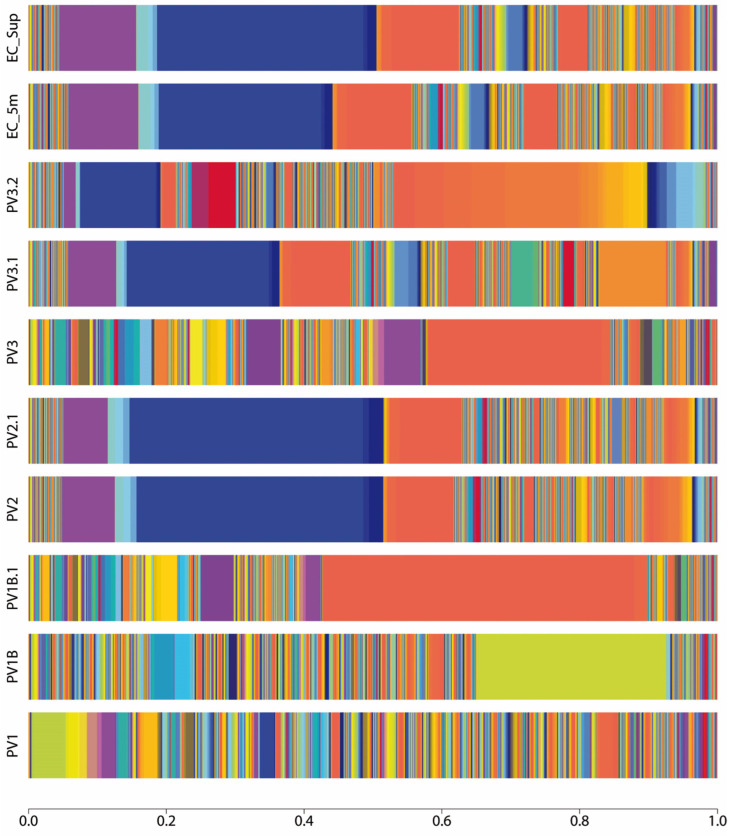
Figure 1.
Taxonomy abundance at the species level represented as stacked bar plot of each sample site of Puerto Varas shore. Three points of the Llanquihue lake beach were sampled (PV1, PV2, PV3) and one point (EC) 200 m far from the coast was sampled, at surface (SUP) and 5 m submerged from the water column (5 m). The sampling was repeated one month later (samples namely with .1). Only PV3 sampling was repeated two months later (namely .2). The color pattern of each bar shows the microbial community structure, while the amplitude of each color represents the percentage of abundance of the assigned taxonomy. The blue color that dominates the taxonomical pattern in PV2, PV2.1, PV3.1, and EC samples belongs to “Candidatus Nanopelagicus abundans”, while the orange color in PV1B.1 and PV3 represents the taxa Prevotella copri. In PV1B, the olive color represents the abundance of the taxa, namely Stenotrophomonas maltophilia.

