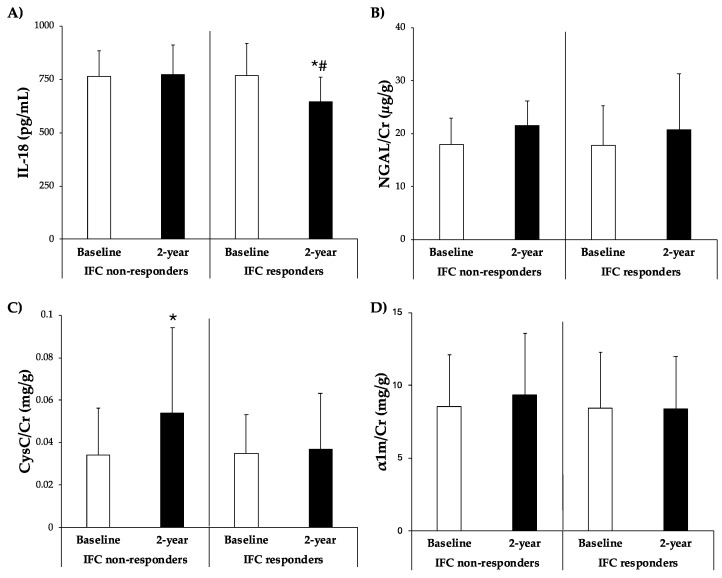
Figure 3.
(A) IL-18 levels in plasma and (B) NGAL/Cr, (C) CysC/Cr, and (D) α1m/Cr levels in urine classified according to improvement of IFC group after 2-year intervention. Results are presented as mean ± SD. Two-way analysis of co-variance (ANCOVA) after adjustments by age and sex. * Difference in means between participants over time (baseline and 2 years). # Difference in means between groups (IFC responders and IFC non-responders). Data points are significant when p < 0.05.

