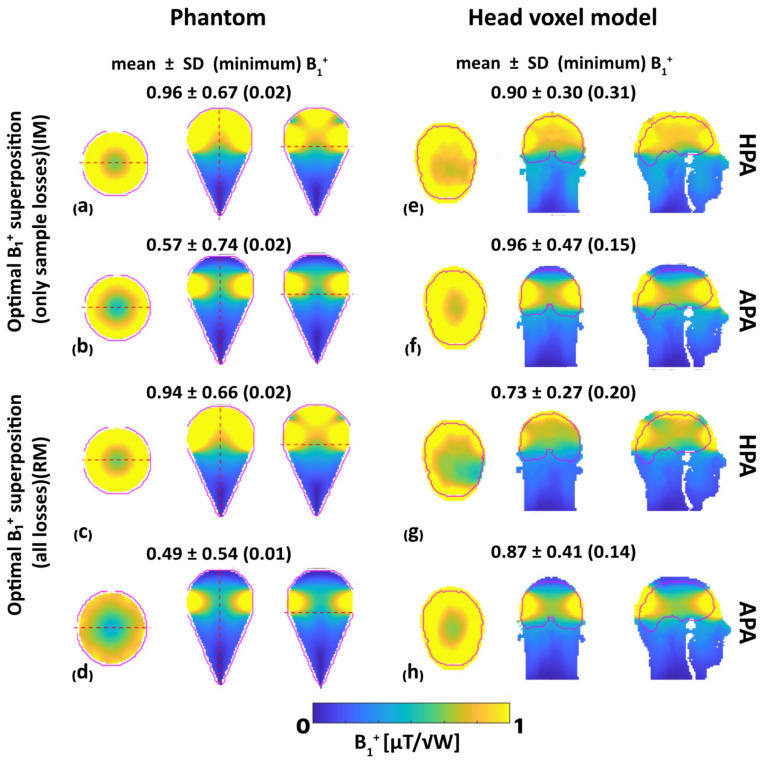
Figure 5.
Simulated superposed B1+ maps for axial, coronal, and sagittal views obtained for the phantom (left) and the human head voxel model (right). Top (a,b,e,f): ideal mode (IM) considering only sample losses, bottom (c,d,g,h): realistic mode (RM) including sample, coil, and coupling losses. Annotations highlight mean ± SD (minimum) B1+ obtained for the HPA and APA RF applicator configurations. The ROI used for the quantitative analysis is highlighted in red.

