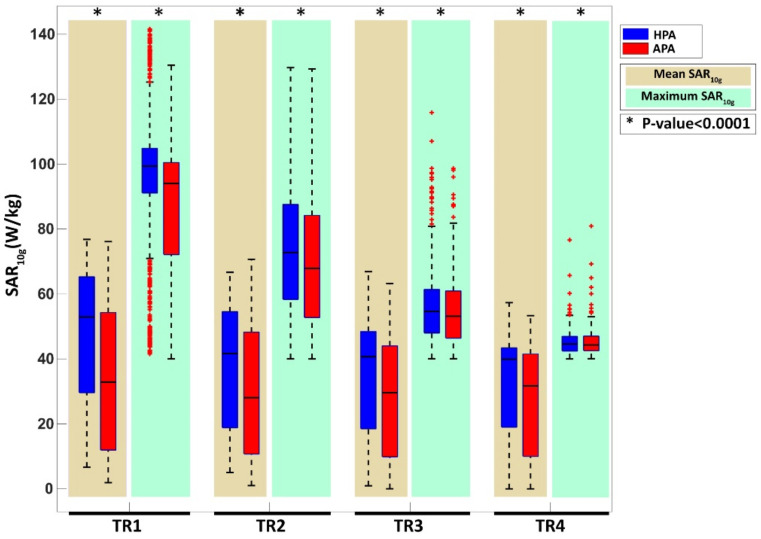
Figure 10.
Comparison of the helmet (blue, HPA) and the annular array (red, APA) for all TRs and locations included in the multi-target evaluation. Results obtained for mean SAR10g in the target region (MTS) are marked with beige bars. Results obtained for the SAR10g,max are marked with green bars. (* p < 0.0001).

