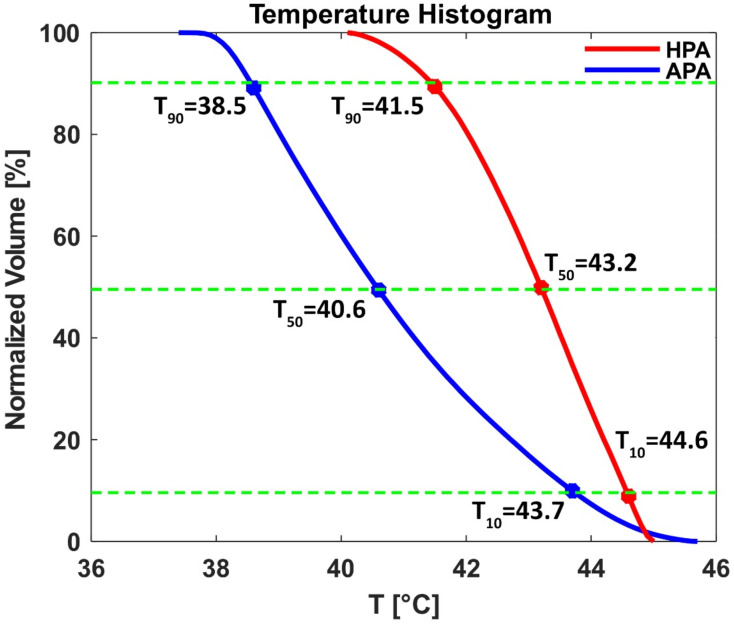
Figure 12.
Temperature volume histogram inside the tumor obtained using HypT optimizer tool of Sim4Life for the APA (blue line) and the HPA (red line). The cumulative normalized volume covered by different temperatures is expressed by T10, T50, and T90. The RF heating achieved for the HPA outperformed the APA. Green dotted lines show 10%, 50% and 90% normalization volume.

