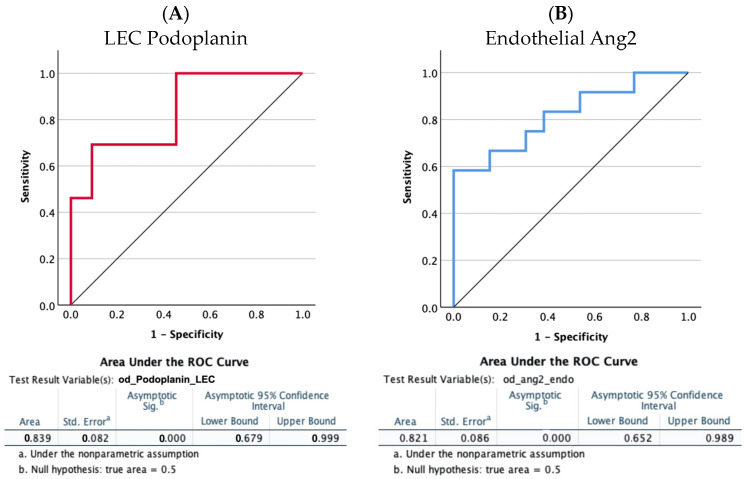
Figure 3.
Receiver operating characteristic (ROC) curve analysis to evaluate the diagnostic power of the LEC podoplanin (A) and of endothelial Ang2 (B) to predict extra-hepatic spread. The area under the ROC curves (AUCs) was analyzed using the Hanley and McNeil method [21]. The AUC values were 0.839 (95% CI 0.679 to 0.999; p < 0.0001) and 0.821 (95% CI 0.652 to 0.989; p < 0.0001).

