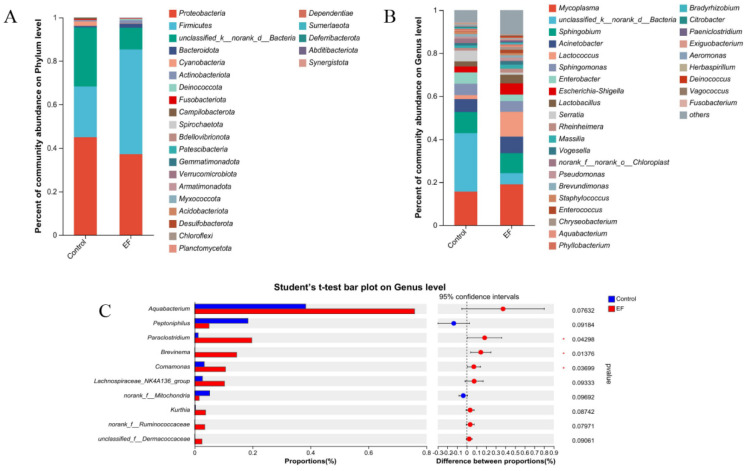
Figure 3.
(A) Distribution of bacterial community structure at phylum level. (B) Distribution of bacterial community structure at the genus level. (C) The significance of differences among the two groups of the same species at the genus level (* represents p < 0.05). The result was statistically analyzed through the Student’s t−test.

