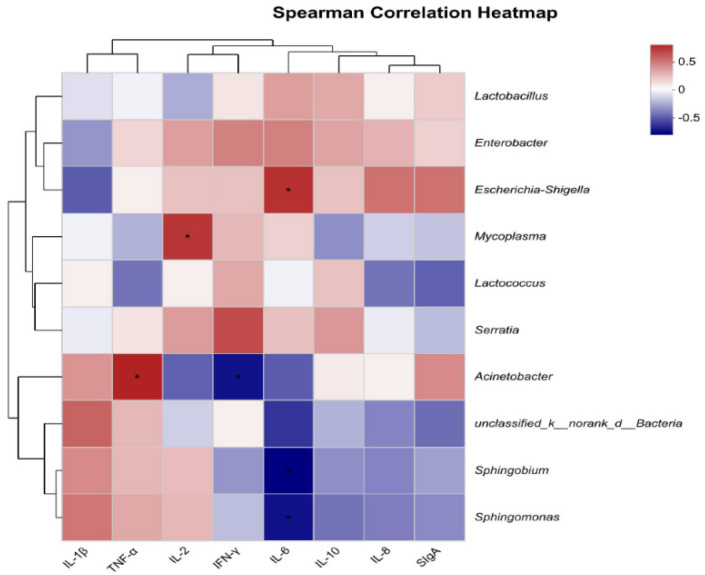
Figure 4.
Heatmap shows the correlation between intestinal flora (genus level) and intestinal immune indicators. The X-axis and Y-axis are intestinal immune indicators and species, respectively, and the correlation R−values and p−values are obtained through calculation. R−values are displayed in different colors in the figure. If the p−values are less than 0.05, they are marked with *. The legend on the right is the color range of different R−values; the left and upper sides present the species and immune indicator cluster trees; * represents p < 0.05.

