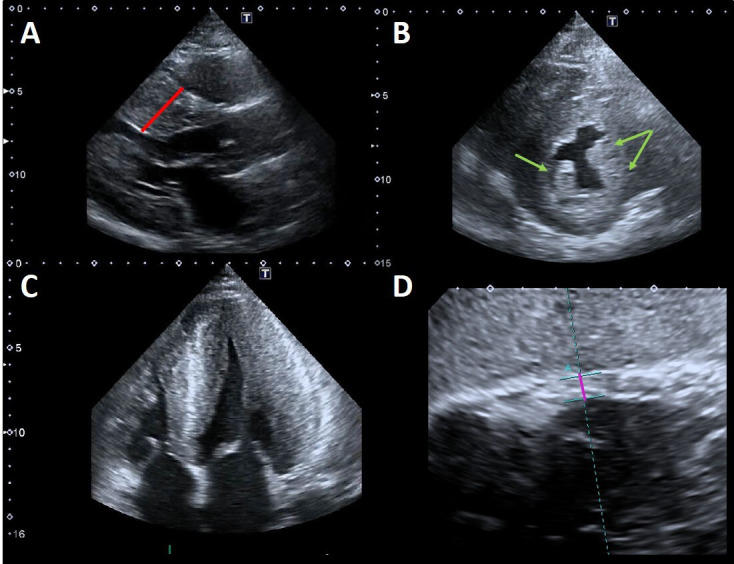
Fig. 2.

Example of advanced Fabry cardiomyopathy. (A) Parasternal long-axis view: the red line shows the maximal wall thickness (30 mm). (B) Parasternal short-axis view: the green arrows point to the prominent hypertrophic papillary muscles. The anterolateral papillary muscle is also bifid (double arrow). (C) Apical four chambers view showing severe concentric LVH with reduced LV cavity dimensions and moderate right ventricular hypertrophy. (D) Subcostal view: the violet line shows the measurement of right ventricular wall thickness (7 mm, n.v. 5 mm).
