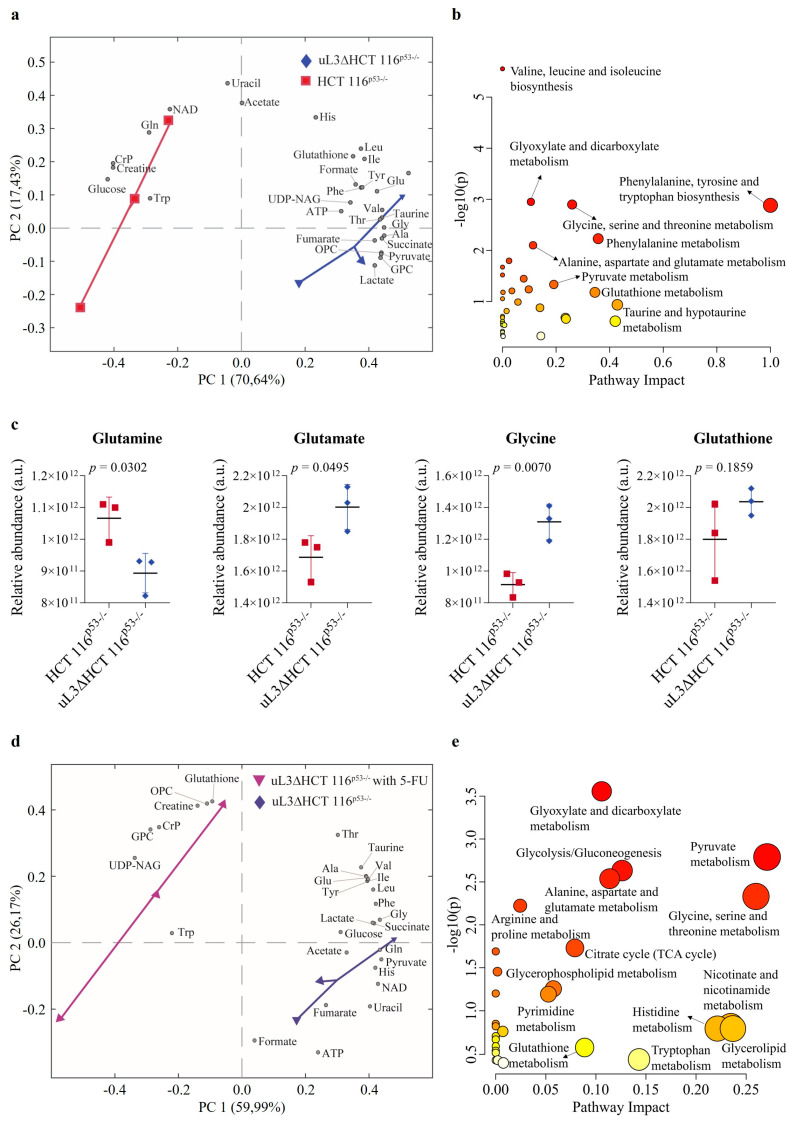
Figure 2.
Effect of uL3 silencing on metabolite profiles. Biplot (scores plot combined with loading plot) of principal component analysis (PCA) model derived from the NMR-based metabolomic analyses of uL3ΔHCT 116p53−/− cells vs. HCT 116p53−/−cells (a) or vs. 5-fluorouracil (5-FU)-treated uL3ΔHCT 116p53−/− cells (d), along with their relative pathway analyses, respectively (b,e). Pathway analyses show all matched pathways according to p-values (p) (y-axis) and pathway impact values (x-axis). Circle colors represent p value from yellow (high p) to red (low p). (NAD, Nicotinamide adenine dinucleotide; CrP, Creatine Phosphate; UDP-NAG, Uridine diphosphate N-acetylglucosamine; OPC, O-phosphocholine; GPC, Glycerophosphocholine; TCA, tricarboxylic acid). (c) Bar graphs reporting the NMR-based relative quantification of glutamine, glutamate, glycine, and glutathione in uL3ΔHCT 116p53−/− cells vs. HCT 116p53−/− cells.

