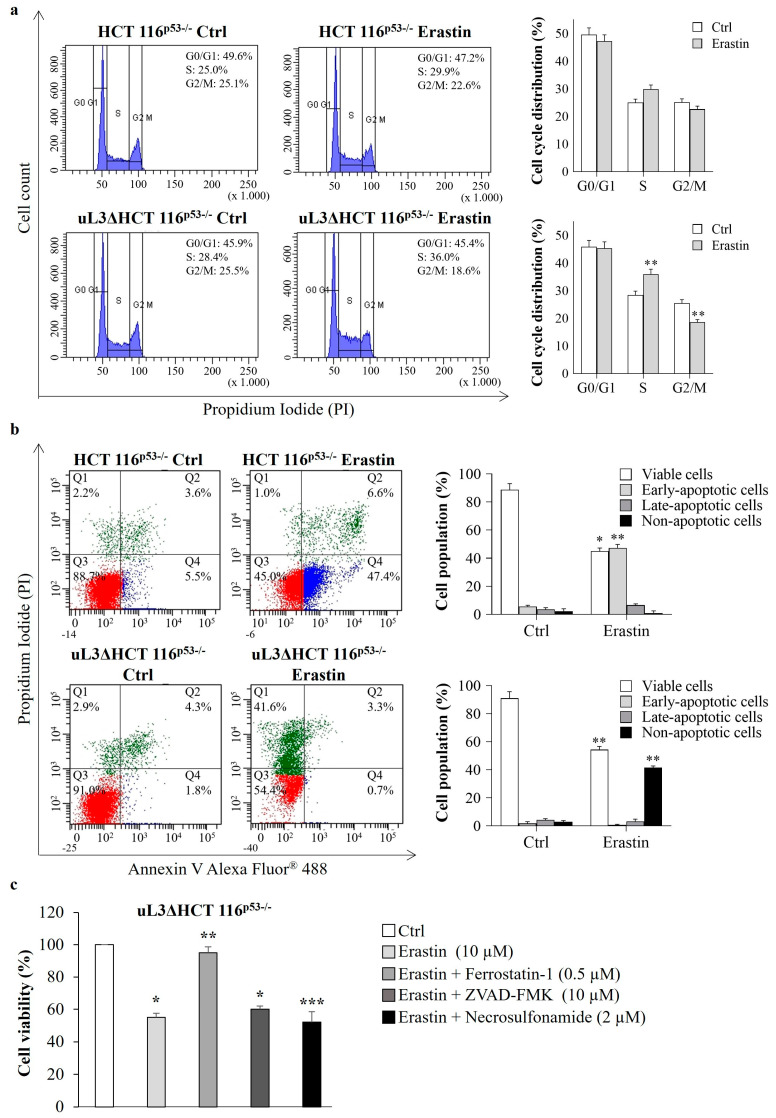
Figure 5.
Effect of erastin treatment on cell cycle distribution and cell death. (a) Representative FACS histograms of propidium iodide (PI)-stained HCT 116p53−/− and uL3∆HCT 116p53−/− cells treated or not with erastin (10 µM) for 24 h. The bar diagram shows the percentage of cells in each phase of the cell cycle. ** p < 0.01 vs. untreated cells. (b) Representative dot blots of Annexin V-Alexa Fluor 488 and PI-stained HCT 116p53−/− and uL3ΔHCT 116p53−/− cells treated or not with erastin (10 µM) for 24 h. The bar diagram shows the percentage of viable cells (Annexin V−/PI−), early apoptotic cells (Annexin V+/PI−), late-apoptotic cells (Annexin V+/PI+) and non-apoptotic cells (Annexin V−/PI+). * p < 0.05, ** p < 0.01 vs. untreated cells. (c) uL3∆HCT 116p53−/− cells were treated with erastin (10 µM) in the absence or presence of ferrostatin-1 (a ferroptosis inhibitor), Z-VAD-FMK (an apoptosis inhibitor), and necrosulfonamide (a necroptosis inhibitor) for 24 h. Then, cell viability was evaluated using the MTT assay. Cell viability of untreated cells was set to 100%. Bars represent the mean of triplicate experiments; error bars represent the standard deviation. * p < 0.05, ** p < 0.01, *** p < 0.001 vs. untreated cells.

