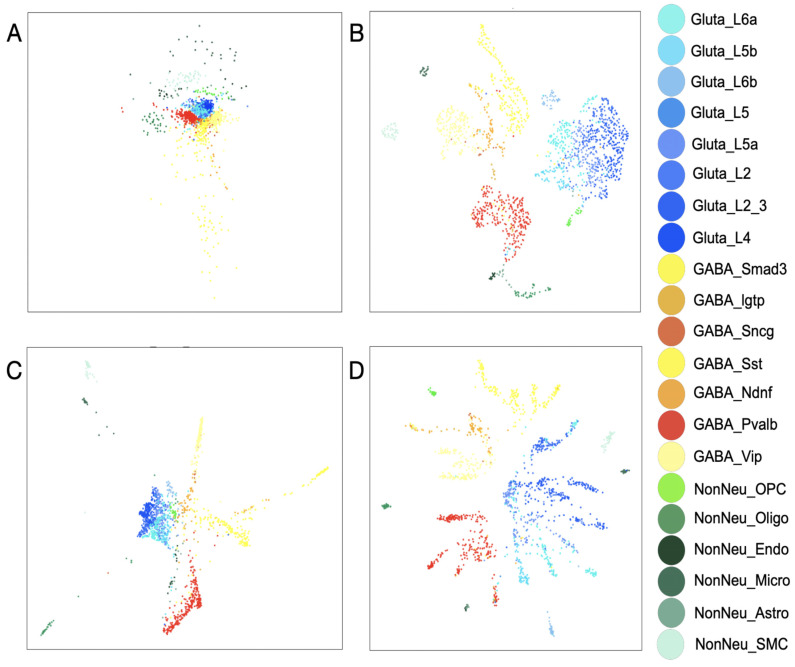
Figure 5.
Multidimensional scaling visualization of a neuronal scRNA-seq dataset. (A) Two-dimensional MDS plot of the PCA manifold (500 PC’s). (B). Two-dimensional UMAP plot (2 UMAP components). (C) Two-dimensional MDS plot of the exponentiated Markov matrix, Mt (500 PC’s, knn = 30, t = 5). (D). Two-dimensional MDS plot of the exponentiated Markov matrix, Mt (500 PCs transformed into 60 UMAP components as input, knn = 30 and, t = 5) of the adult mouse visual cortex cells dataset. Note: For the adult mouse visual cortex cells dataset, three main clusters are GABAergic (red-yellowish), glutamatergic (blueish), and non-neuronal (greenish) cell types.

