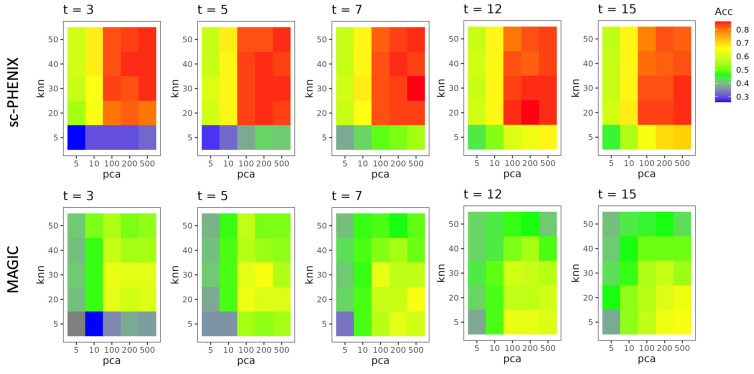
Figure 6.
Overview of the accuracy of the knn classifier model on the 2D-MDS space derived from MAGIC’s and sc-PHENIX’s exponentiated Markovian matrix. Each plot represents different combinations of diffusion parameters t, knn values, and PCA dimensions. The color gradient, using a rainbow palette, indicates the classifier accuracy, with red representing higher accuracy and blue representing lower accuracy. The top row corresponds to MAGIC, while the bottom row corresponds to sc-PHENIX. The results show how increasing t, knn, and PCA dimensions affect local structure preservation.

