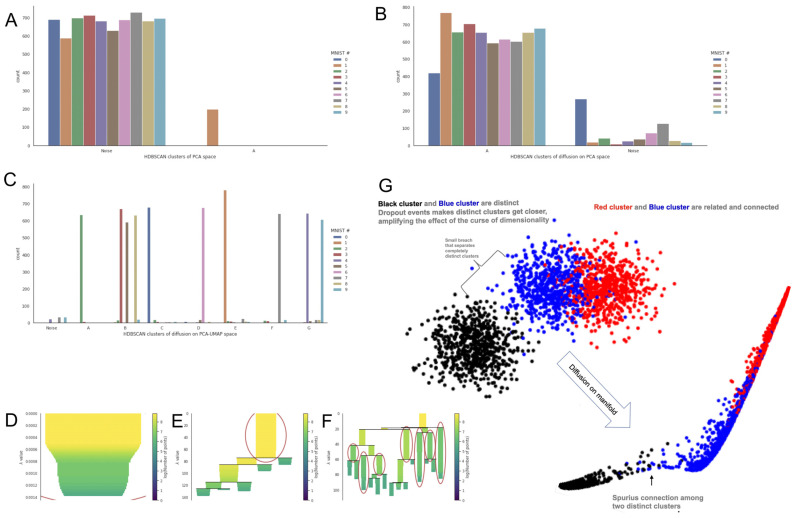
Figure 7.
HDBSCAN clusters on the exponentiated Markov matrix of sc-PHENIX. Clusters were assigned as letters (A, B, C, etc.). (A) MNIST samples distribution of different HDBSCAN clusters (PCA space). (B) Distribution of MNIST samples on different HDBSCAN clusters of the Mt (diffusion on PCA space, also known as MAGIC). (C) Distribution of MNIST samples on different HDBSCAN clusters of the Mt (diffusion on PCA-UMAP space, also known as sc-PHENIX). (D) Condense tree plot (PCA space). (E) Condense tree plot (diffusion on PCA space). (F) Condense tree plot (diffusion on PCA-UMAP space). (G) Scheme of an inaccurate diffusion process. Diffusion in PCA space connects two distinct clusters (black and blue). This connection occurs in the proximate regions between different clusters (distinct cell phenotypes) separated by a small gap. Due to the diffusion process, this artifact includes spurious neighboring samples that do not share similar features. This occurs because all points (cells) are relatively close to each other in the multidimensional PCA space, and PCA does not provide sufficient separation. Note: In (D–F), the red circles indicate the most stable and persistent clusters identified by HDBSCAN. These clusters are highlighted because they exhibit higher stability, measured by the λ values at which points remain within them before splitting into smaller clusters, indicating their significance and robustness.

