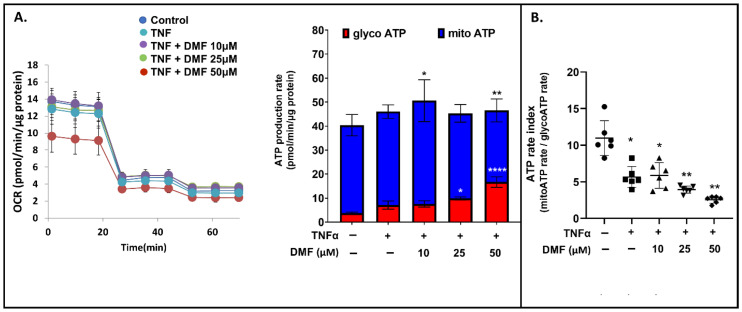
Figure 6.
Seahorse XF real-time ATP rate analysis of VSMCs. (A) Left panel: Representative oxygen consumption rate (OCR) profile; Right panel: Mitochondrial and glycolytic ATP production rates in VSMCs treated with TNFα ± DMF. (B) XF ATP rate index calculated from data in panel A. All Seahorse data shown are compiled from three independent experiments using four technical replicates per experiment per condition and normalized by protein content (two-way ANOVA with Dunnett’s post hoc against the control group: **** p < 0.0001; ** p < 0.01; * p < 0.05).

