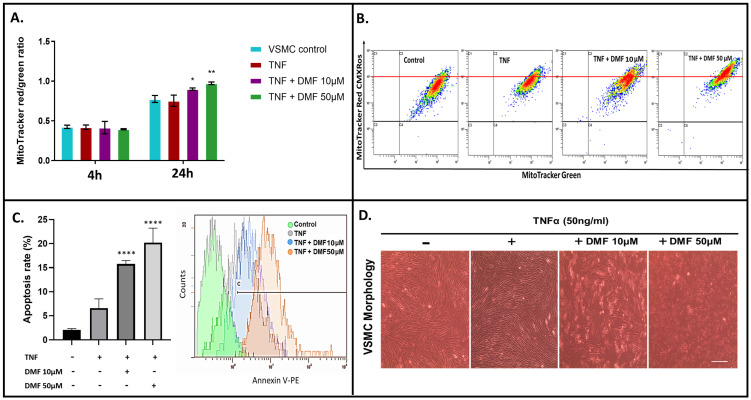
Figure 8.
Mitochondrial dysfunction and cellular apoptosis. (A) VSMCs treated with TNFα ± DMF for 4 h were stained with MitoTracker Red CM-H2XRos and MitoTracker Green, and the fluorescence intensities were quantified using flow cytometry. The red:green ratio was calculated to detect changes in ROS while adjusting for any concomitant changes in mitochondrial mass. (B) Representative gating of mean fluorescence intensity (MFI) across conditions. (C) Quantification of apoptosis rate evaluated by flow cytometry. (D) Light microscope images of cultured VSMCs showing cell density after TNFα ± DMF (20×), scale bar (100 µm). All data shown are compiled from three independent experiments (two-way ANOVA with Dunnett’s post hoc against the control group: **** p < 0.0001; ** p < 0.01; * p < 0.05).

