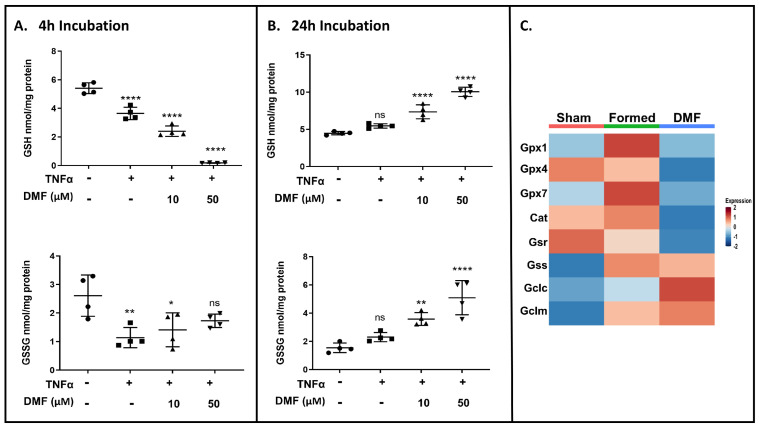
Figure 10.
Time course for GSH consumption. Total GSH (top) and GSSG (bottom) determined at (A) 4 h and (B) 24 h in VSMCs treated with TNFα ± DMF. (C) Heatmap showing relative gene expression levels (columns) of GSH de novo and recycling pathway. All data shown were compiled from three independent experiments (one-way ANOVA with Dunnett’s post hoc against the control group: **** p < 0.0001; ** p < 0.01, * p < 0.05, ns = not significant).

