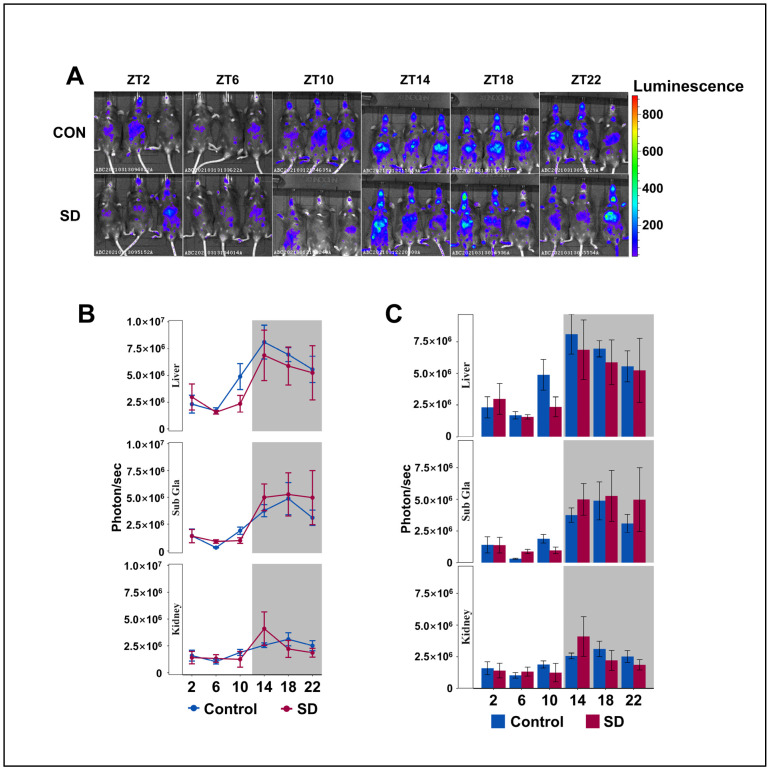
Figure 3.
Peripheral Per2 rhythms exhibited subtle changes following prolonged sleep deprivation. (A) Fluorescent images of the submandibular gland, liver, and kidneys of PER2: LUC mice in the sleep-deprived (SD) and control (CON) groups at 2–3 min after an injection of fluorescein (n = 3 per group of mice at each time point). (B,C) Quantification of the submandibular gland, liver, and kidney bioluminescence data in (A), shown in photons per second (n = 3 per group of mice at each time point). Data represent the mean ± standard deviation. Statistical significance represents the comparison between the Control and SD groups, as per an unpaired Student’s t-test. (see File S3 in the Supplementary Materials).

