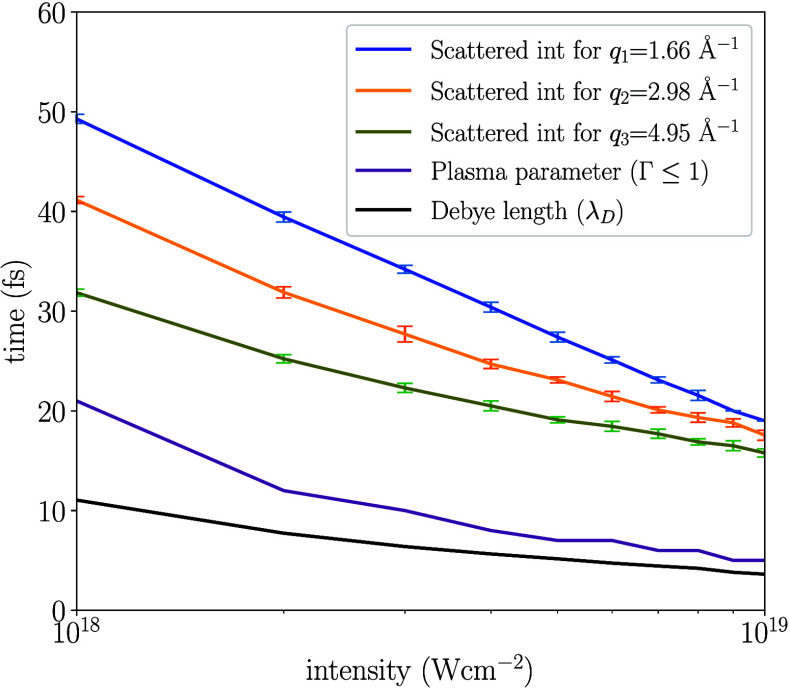
Figure 3.
Dynamics of the ice melting passing through the transient crystalline plasma phases, as a function of the incident XFEL intensity. From bottom-up, the lines show: (i) Time-point for the convergence of the Debye length λD that governs the shielding of the Coulomb interactions. (ii) Plasma parameter (Γ = 1) where potential and kinetic energy are equal, below the line the kinetic energy dominates (Γ < 1). (iii) Lines where the scattered intensity at different q values drops to I(tthreshold) = I(t = 0)/2. This time-point is averaged over multiple trajectories with different charge distributions, where the error bars correspond to one standard deviation. The plot indicates how the system transitions out from the strongly coupled (condensed matter) phase to a state where the kinetic and potential energy are similar. The results show that the region between the convergence of the plasma parameter and the threshold time of the drop of the scattered intensity for different q values correspond to the crystalline plasma states. The point in time above the black line corresponds to an unordered plasma phase.

