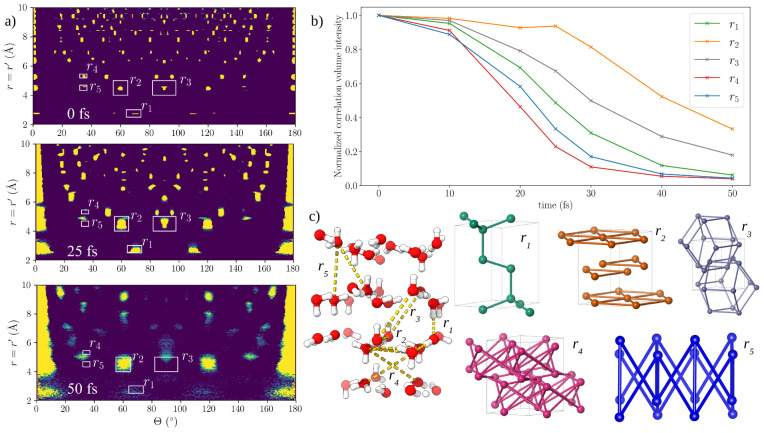
Figure 4.
(a) Slice of the pair angular distribution function (PADFs) for r = r′ of simulated ice structures with intensity 1 × 10¹⁸ W cm–2 at 0, 25, and 50 fs. Areas of high intensity (yellow) indicate frequently observed angular arrangements in the structure. Prominent nearest- and next-nearest neighbor arrangements are labeled r1–5. (b) Changes in correlation intensity for the peaks r1–5 indicate the persistence of arrangements related to the hexagonal oxygen packing (all peaks are normalized to 1 at t = 0). (c) Geometries of the structure corresponding to arrangements of oxygen atoms (red spheres) and interatomic vectors contributing to each prominent arrangement. The same trend is seen for higher intensities as shown in the SI.

