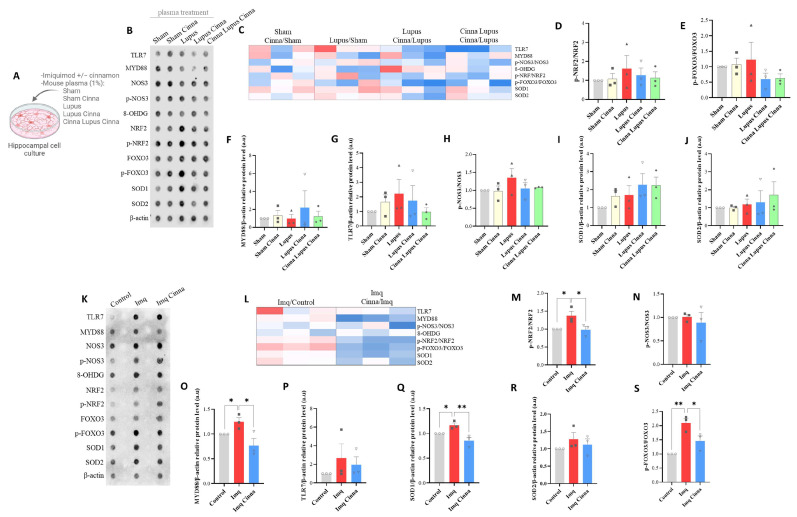
Figure 4.
(A) Schematic representation of in vitro treatment of cultured hippocampal cells with imiquimod, imiquimod with cinnamon, or the plasma of different mice groups. (B–J) Antibody arrays, heatmap, and quantification of TLR7, MYD88, and oxidative stress markers in hippocampal cells treated with the plasma of different mice groups. (K–S) Antibody arrays, heatmap, and histograms of TLR7, MYD88, and oxidative stress markers in cultured hippocampal cells treated with imiquimod, cinnamon with imiquimod, or sham. a.u.: arbitrary units. * p < 0.05, ** p < 0.01.

