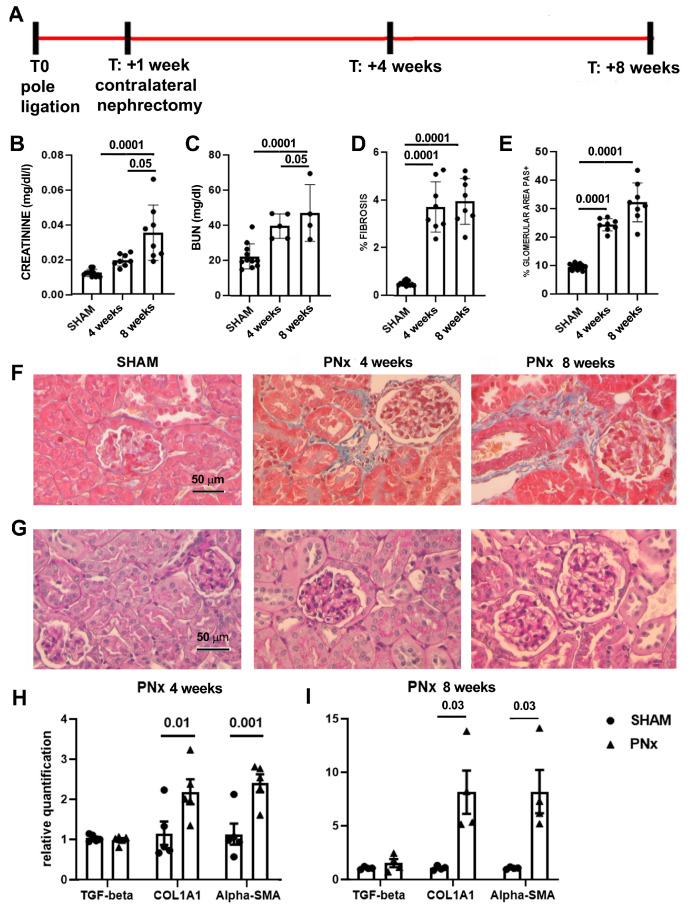
Figure 1.
CKD development in 5/6th partial nephrectomy (PNx) model. (A) Layout of the experiments to set up the in vivo model. At T0, mice were subjected to pole ligation of the left kidney; one week later, the right kidney was removed (contralateral nephrectomy). Mice were sacrificed 4 and 8 weeks after the second surgery to evaluate CKD progression. (B,C) Evaluation of creatinine (B) and BUN (C) plasma levels of control SHAM mice (n = 12) and PNx mice sacrificed 4 and 8 weeks after nephrectomy (n = 8 mice/time point). Results are shown as mean ± SD. (D) Quantification of fibrosis by histological analyses in SHAM and PNx mice sacrificed 4 and 8 weeks after nephrectomy. Results are shown as mean ± SD. (E) Histological quantification of glomerular PAS+ deposition in SHAM and PNx mice sacrificed 4 and 8 weeks after nephrectomy. Results are shown as mean ± SD. (F) Representative photographs of Masson’s trichrome stained renal sections of SHAM and PNx mice sacrificed 4 and 8 weeks after nephrectomy. The blue stain represents collagen fibers. Original magnification: 400×. Bar scale: 50 μm. (G) Representative micrographs of PAS-stained renal sections of SHAM and PNx mice sacrificed 4 and 8 weeks after nephrectomy. Original magnification: 400×. Bar scale: 50 μm. (H,I) Gene expression levels of fibrotic markers (TGF-beta, COL1A1, and alpha-SMA) in PNx mice sacrificed 4 ((H), n = 5) and 8 ((I), n = 4) weeks after nephrectomy with respect to SHAM mice. Data are normalized to GAPDH. Mean ± SEM was calculated by comparing the gene expression levels of each group with the ones of the SHAM mice.

