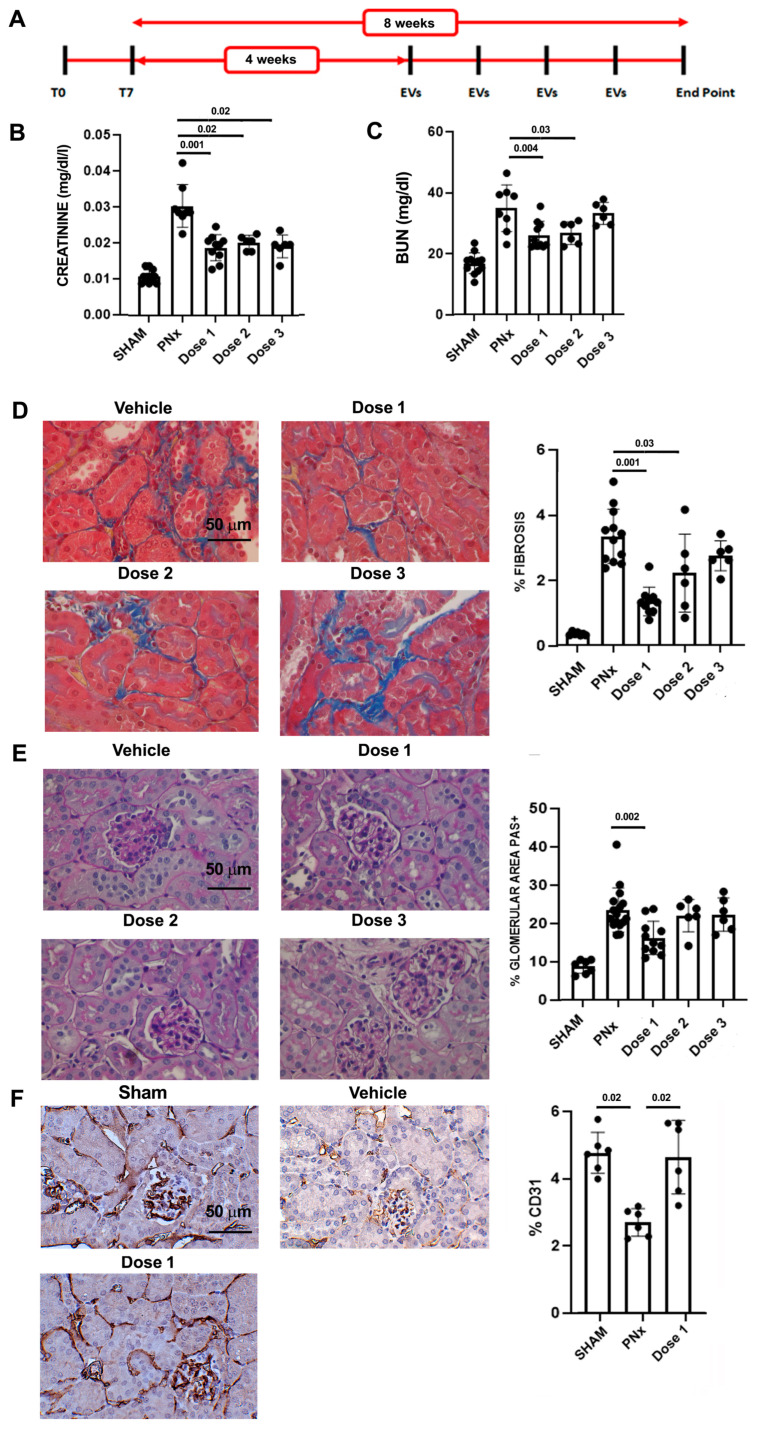
Figure 2.
Effects of different EV doses on renal function and morphology. (A) Experimental layout to test EVs in CKD mice, showing the time points of surgeries (T0 and T7), EV administrations, and sacrifice (end point). (B,C) Evaluation of creatinine (B) and BUN (C) plasma levels of control SHAM mice (n = 12) and PNx mice sacrificed 8 weeks after surgery treated with vehicle alone (n = 8) or with different doses of EVs (n = 10/dose 1 and n = 6/doses 2 and 3). Results are shown as mean ± SD. (D) Representative photographs of Masson’s trichrome stained renal sections of PNx mice treated with vehicle alone or with different doses of EVs. Original magnification: 400×. Bar scale: 50 μm. Bar chart on the right represents quantification of fibrosis of the different experimental groups. (E) Representative images of PAS-stained renal sections of PNx mice treated with vehicle alone or with different doses of EVs. Original magnification: 400×. Bar scale: 50 μm. Bar chart on the right represents histological quantification of glomerular PAS+ deposition in the different experimental groups. (F) Representative photographs of CD31 antibody-stained renal sections of SHAM mice and PNx mice treated with vehicle alone or with dose 1. Original magnification: 400×. Bar scale: 50 μm. In the graph on the right, CD31 expression was quantified in each experimental group.

