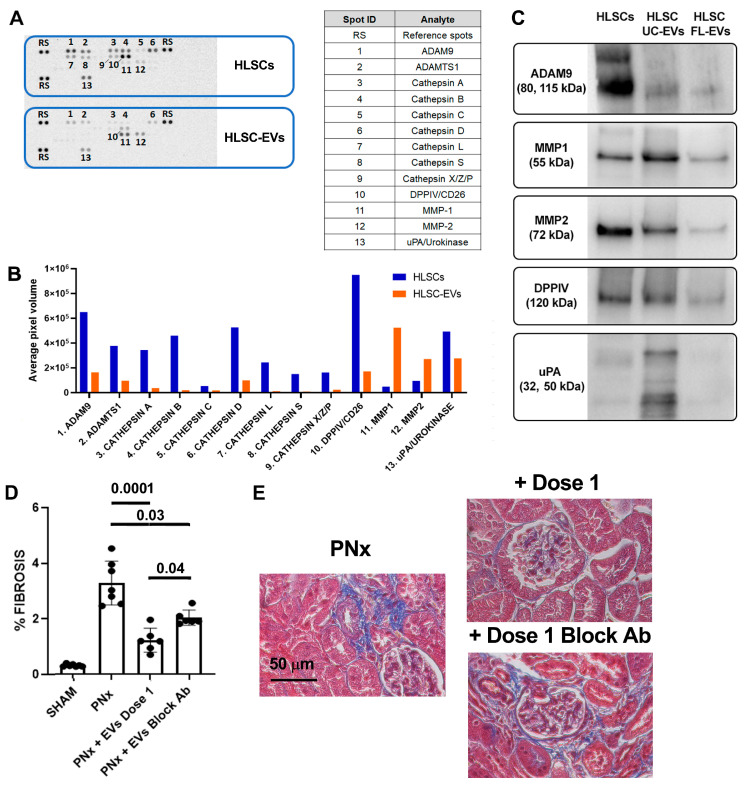
Figure 7.
Protease expression profile in EVs. (A) Representative image of the results of Proteome ProfilerTM Human Protease Array, comparing the expression of 35 human proteases among HLSC and HLSC-EV protein lysates. The top 13 proteases expressed in cells and EVs are listed in the table on the right. (B) Histogram representing the average signal (pixel density of the spots) of the 13 proteases expressed in cell protein lysate (blue bars) and in EV lysate (orange bars). (C) Representative image of the results of Western blot analyses of 5 proteases expressed in the protein lysate of cells and EVs purified by ultracentrifugation (UC-EVs) and EVs purified by floating (FL-EVs). (D) Histological quantification of fibrosis in SHAM mice, PNx mice treated with vehicle alone, and PNx mice injected with dose 1 of EVs pre-treated or not with blocking antibody (n = 6/group). Results are shown as mean ± SD. (E) Representative images of renal sections of PNx mice treated with vehicle alone or with dose 1 of EVs pre-treated or not with specific blocking antibody stained with Masson’s trichrome. The blue stain represents collagen fibers. Original magnification: 400×. Bar scale: 50 μm.

