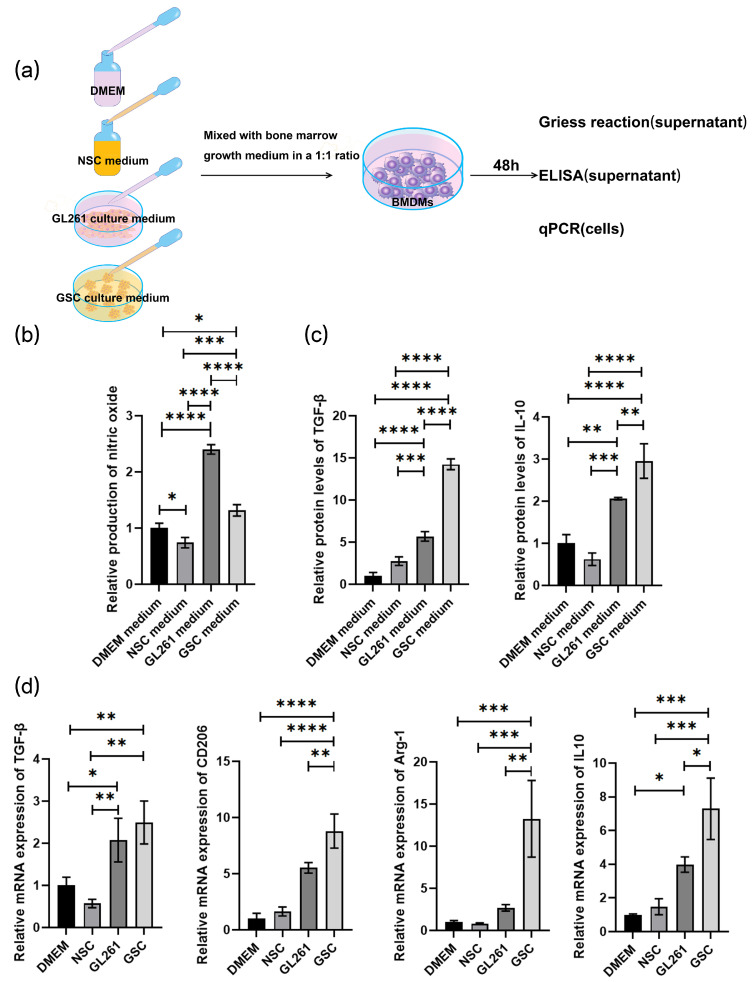
Figure 3.
GL261-GSCs induce macrophage M2 polarization: (a) BMDMs were cocultured with blank DMEM medium, blank NSC medium, culture medium of GL261 cells, and culture medium of GL261-GSCs; (b) relative quantitative results of the Griess experiment in the culture medium of four groups of BMDMs (BMDMs cultured with blank DMEM medium, blank NSC medium, culture medium of GL261 cells, and culture medium of GL261-GSC cells) (n = 3); (c) relative quantitative results of ELISA experiment of TGF-β and IL10 protein levels in the culture medium of four groups of BMDMs (BMDMs cultured with blank DMEM medium, blank NSC medium, culture medium of GL261 cells, and culture medium of GL261-GSC cells) (n = 3); (d) relative quantitative results of qRT-PCR analysis of the expression TGF-β, CD206, Arg-1, and IL-10 in four groups of BMDMs (BMDMs cultured with blank DMEM medium, blank NSC medium, the culture medium of GL261 cells, and the medium of GL261-GSC cells) (n = 3). Data are presented as mean ± S.D. p-value is determined by ordinary one-way ANOVA (* p < 0.05, ** p < 0.01, *** p < 0.001, **** p < 0.0001).

