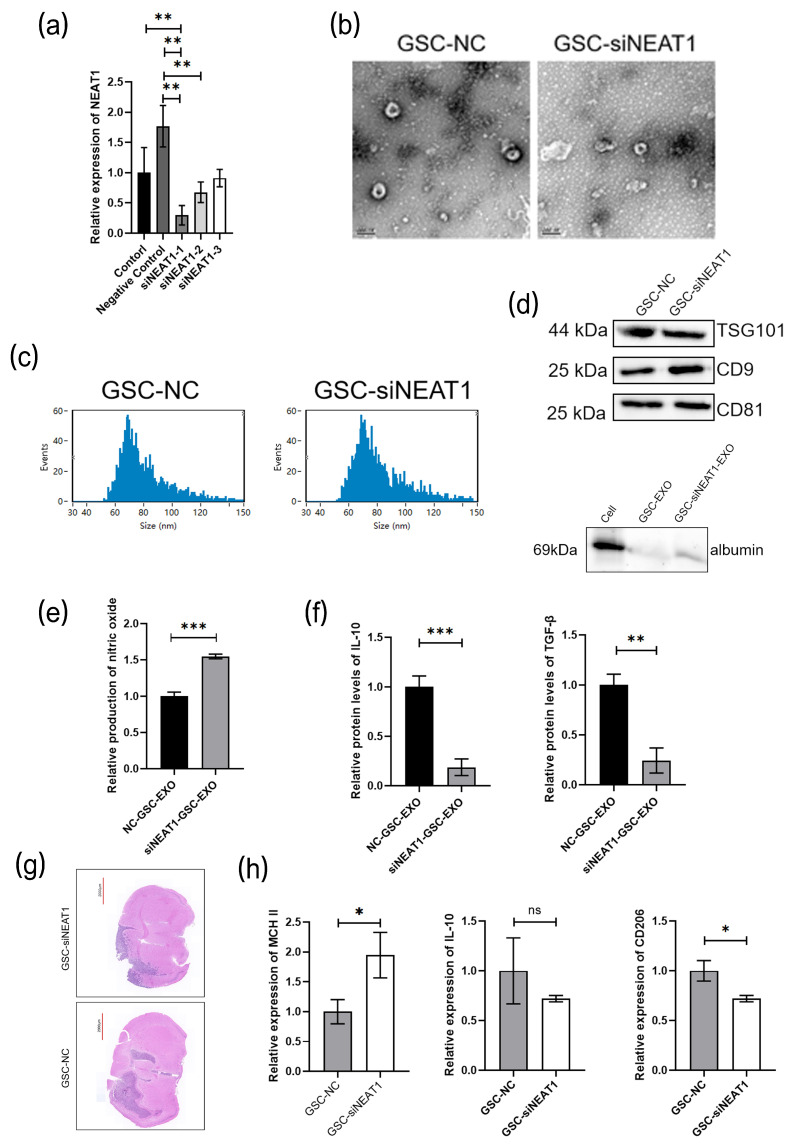
Figure 7.
(a) NEAT1 siRNAs are transfected into the GSCs and then the expression of NEAT1 is assessed by qRT-PCR analysis. GAPDH is used as a reference gene (n = 3); (b) representative image of electron microscope of exosomes collected from the culture medium of GSC-NC and GSC-siNEAT1 cells; (c) particle size map of exosomes from GSC-NC and GSC-siNEAT1 cells. (d) Proteins are extracted from the exosomes of GSC-NC and GSC-siNEAT1 and the expression of CD9, CD81, TSG101, and albumin are determined by Western blot analysis; (e) relative quantitative results of the Griess experiment in the culture medium of GSC-NC-EXO and GSC-siNEAT1-EXO (n = 3); (f) relative quantitative results of ELISA experiment of TGF-β and IL10 protein levels in the culture medium of GSC-NC and GSC-siNEAT1 cells (n = 3); (g) HE staining image of mice tumor section; (h) relative quantitative results of qRT-PCR analysis of the expression MCH II, IL10, and CD206 in macrophages in tumors from different groups of mice;. GAPDH is used as a reference gene (n = 3). Data are presented as the mean ± S.D. p-value is determined by Student’s t-test or ordinary one-way ANOVA (* p < 0.05, ** p < 0.01, *** p < 0.001, ns = not significant).

