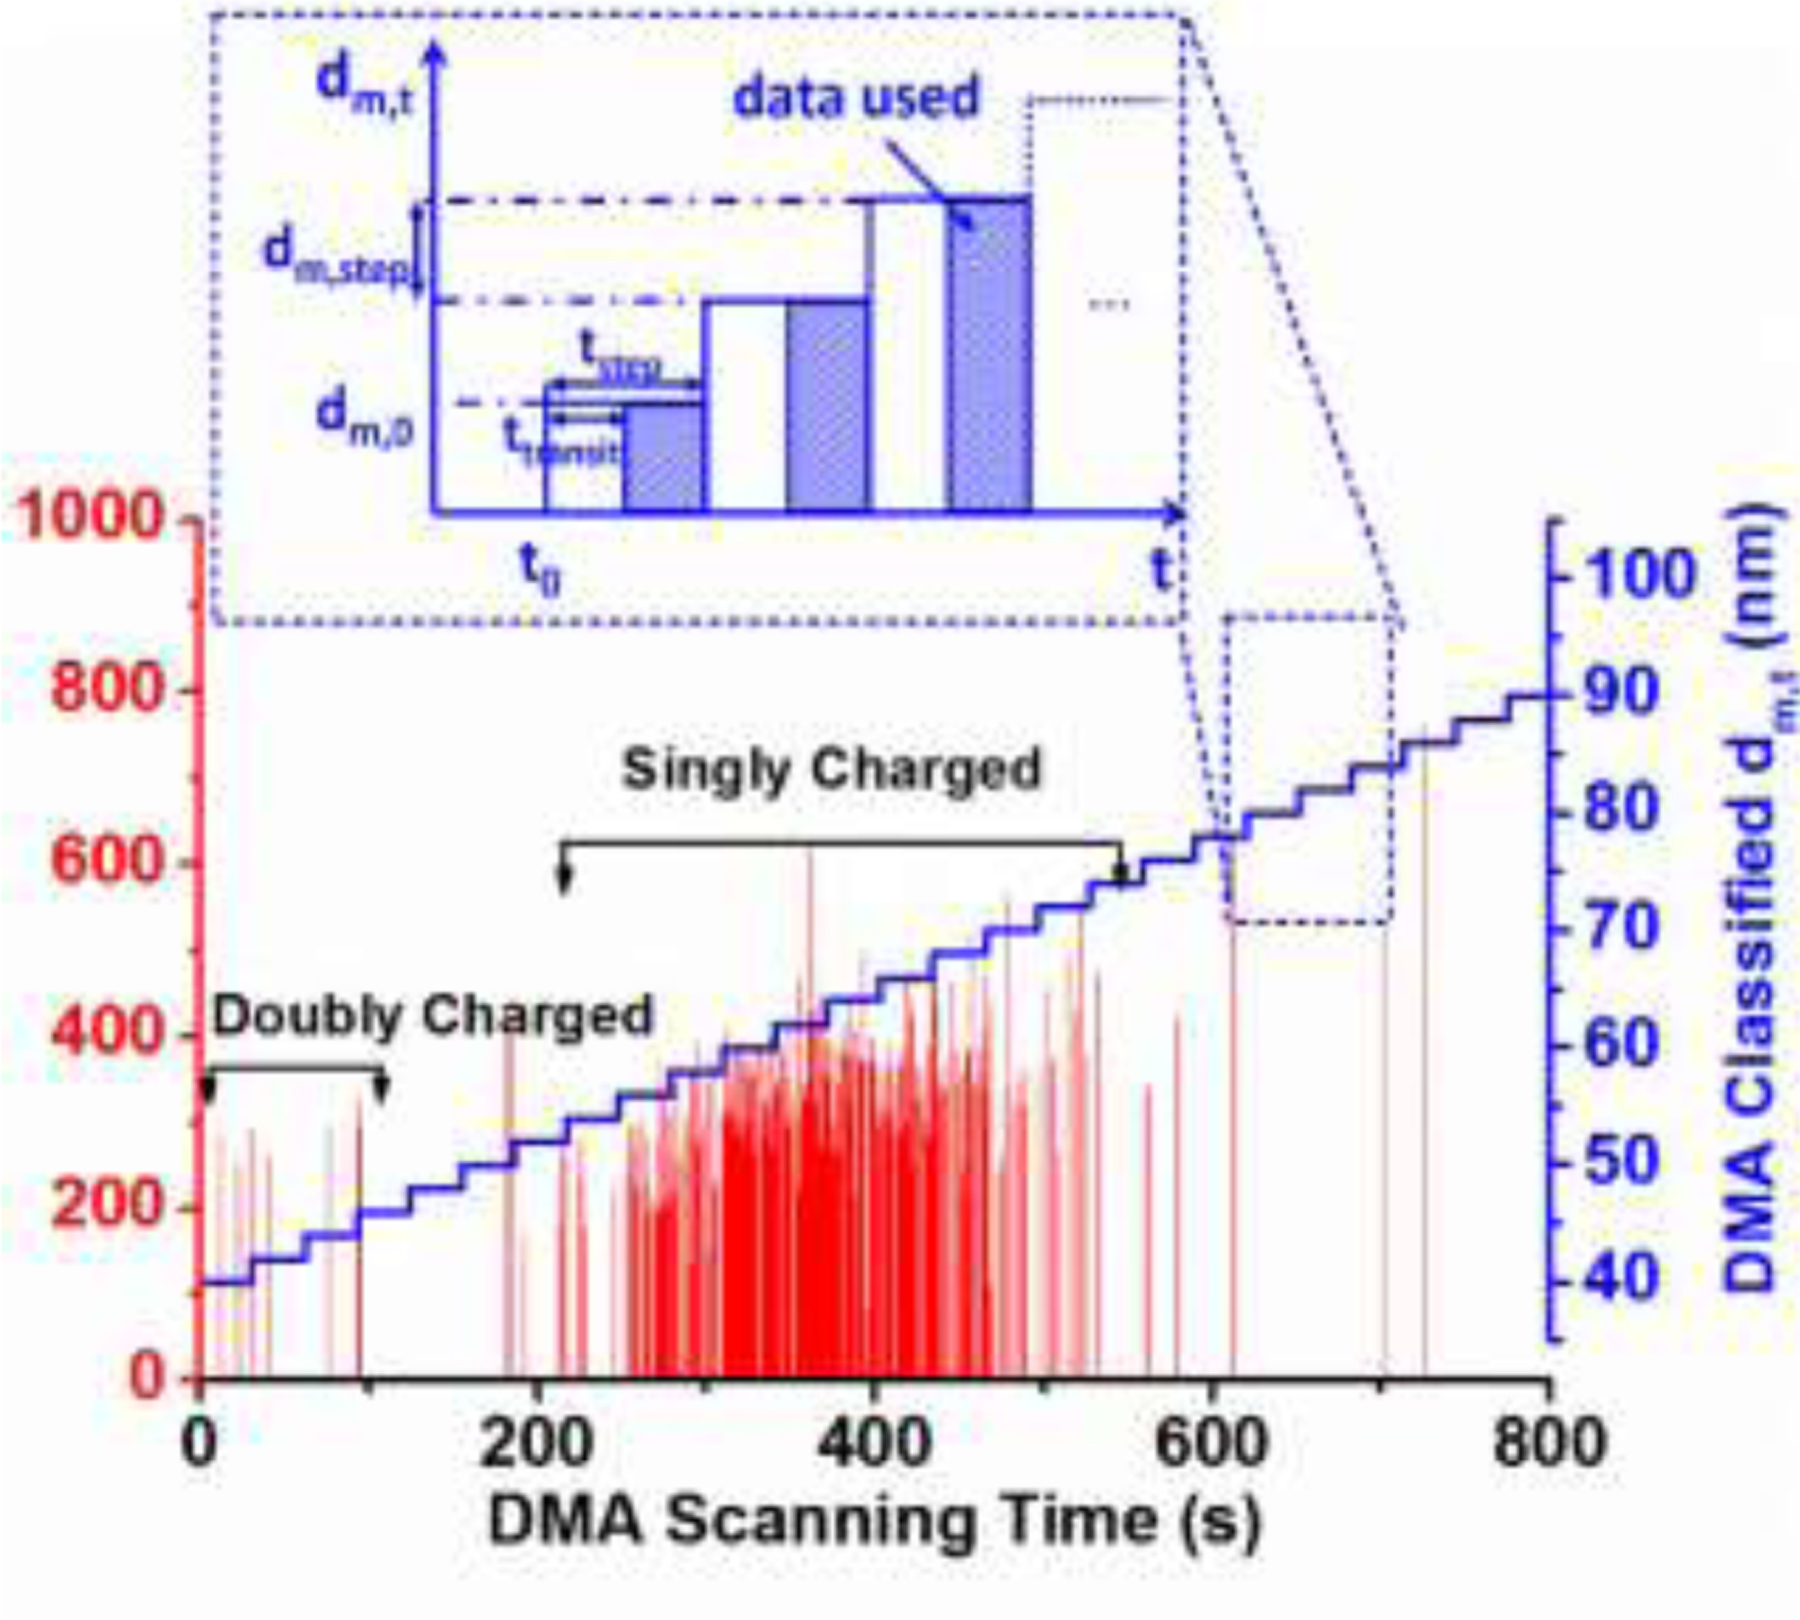
Figure 2.

spICP-MS intensity spectrum as a function of DMA scanning time for 60 nm AuNPs. Single particle events are presented as red spikes. The selected by the DMA with respect to time is represented by the stepped blue line following Eq. 4 (, , and ). Two major populations representing singly and doubly charged 60 nm AuNPs are highlighted by the black brackets. Inset shows operational features of DMA-spICP-MS relevant to data acquisition (Eq. 4).
